
On-chain data shows that the Bitcoin aSOPR metric has fallen to lows not seen since December 2018, suggesting that holder capitulation is deepening.
Bitcoin aSOPR plummets to lows not seen nearly 4 years ago
As noted by an analyst in a CryptoQuant afteris the current capitulation deeper than during both the bear of 2015 and the COVID crash.
The “Spent output profit ratio(or SOPR for short) is an indicator that tells us whether Bitcoin investors are currently selling at a loss or at a profit.
When the value of this metric is greater than 1, it means that the overall market is currently making some profit.
On the other hand, the indicator with values below the threshold implies that the average holder is currently selling at a loss.
Of course, the SOPR, which is exactly equal to 1, suggests that investors as a whole are just breaking even at this point.
A modified version of this statistic is the “SOPR modified” (aSOPR), which does not take into account sales of coins made within 1 hour of purchasing those coins. As a result, the indicator filters out any noise from the data that would not have had a significant impact on the market.
Now, here is a chart showing the trend in the Bitcoin aSOPR since the year 2014:
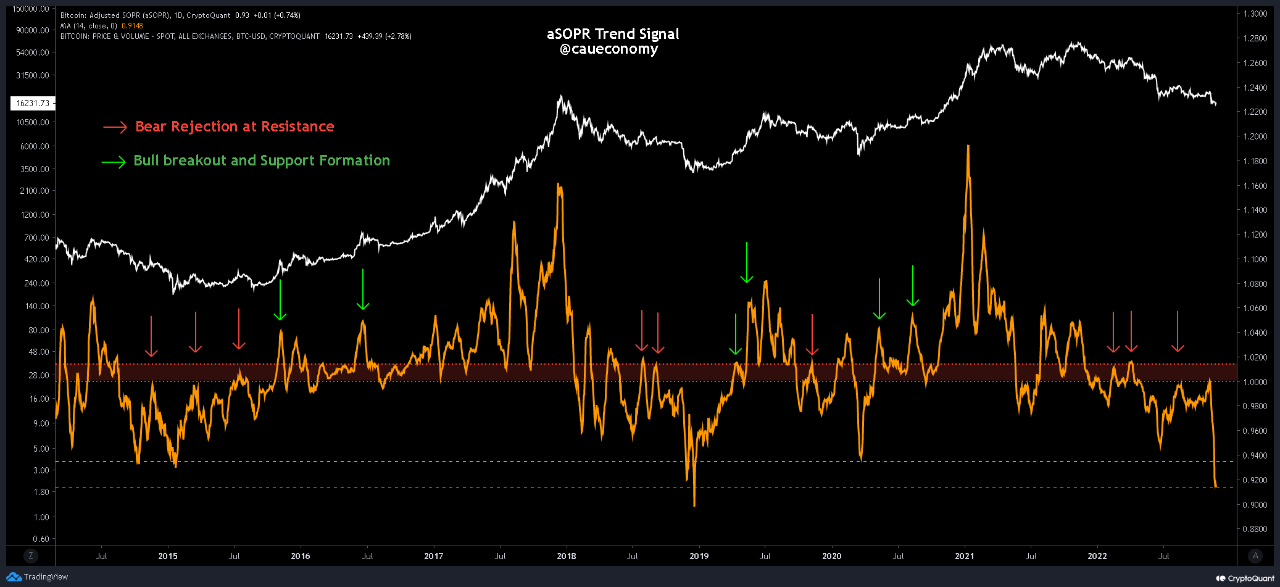
The value of the metric seems to have seen a heavy drawdown in recent days | Source: CryptoQuant
As you can see in the chart above, the Bitcoin aSOPR has recently observed a rapid downward trajectory below the 1 level. This means that BTC investors have been selling their coins at huge losses.
The value of the indicator is now the lowest since December 2018, when the previous cycle’s bear market bottomed out.
These current levels of the metric are also lower than during both the 2015 bear market bottom and the COVID Black Swan crash.
Drops in the aSOPR, such as the one right now, indicate that widespread capitulation is underway in the Bitcoin market. Such realizations of large losses have historically led to the formation of price lows as they result in a shift in coins from weak hands to strong hands.
As the indicator is currently at an all-time low, it is possible that the market is approaching a bottom for this cycle. However, it is worth noting that the bottom of 2018 showed even deeper values than now, so it is uncertain whether the current cycle will also see similar lows or not before the real bottom is reached.
BTC price
At the moment of writing, The price of Bitcoin floating around $16.5k, up 1% over the past week.

BTC has shown strong uptrend in the last two days | Source: BTCUSD on TradingView
Featured image from 愚木混株 cdd20 on Unsplash.com, charts from TradingView.com, CryptoQuant.com


