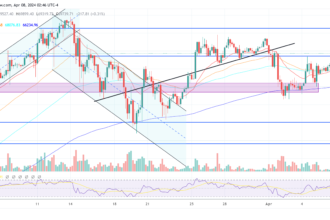
Bitcoin has shown some strength in today’s trading session after revisiting the bottom of a key trendline. The benchmark crypto traded in a tight range, between $18,600 and $19,500, but the monthly close could support a spike in volatility as bulls and bears fight for this candle.
At the time of writing, Bitcoin (BTC) is trading at $19,400 with gains of 2% in the last 24 hours and 7 days. Other cryptocurrencies seem to be the next Bitcoin as they make small gains in short periods of time. The benchmark crypto may be preparing for further gains.

Bitcoin sets the tone for more profits?
In addition to the monthly close, Bitcoin’s recent price action appears to be supported by a crash in the US dollar. The currency was able to reach levels last seen in the early 2000s when it hit 115 on the DXY index, but it was knocked off these levels.
At the time of writing, the DXY index is trading at 112 and could return to its early September low, much further south. The rally of the DXY index has been one of the main obstacles covering the upside potential of Bitcoin and other risky assets, such as stocks.
In that sense, a revisit from the September lows could allow the crypto market to extend its current bullish price action in the coming weeks. According to analyst Justin Bennett, the price action of the DXY index could support a Bitcoin rally back to $26,000.
The cryptocurrency could reach this level before the next meeting of the Federal Reserve Federal Open Market Committee (FOMC). As can be seen in the chart below, Bennett claims that Bitcoin traded in a channel with a bottom of around $18,700 and a top of $27,000.
With a downward trade in US dollars, Bitcoin may be able to regain the high of this channel. The analyst wrote, “As long as $18,700 holds, this is my Bitcoin playbook through October”.

Bitcoin on a Lighter “Bear Market”?
Additional data from a pseudonym analyst indicates Bitcoin may be in lighter downward price action. The analyst looked at BTC’s past price decline from its all-time highs (ATH) and found that the cryptocurrency is only 74% away from those levels.
In the bear markets of 2013 and 2017, Bitcoin crashed by 84% from its previous all-time high and by 93% in 2011. This could indicate that the BTC bear market is weakening or that the cryptocurrency could see another step down.
In addition, the analyst found that Bitcoin is 316 days away from its all-time high. In previous years, the cryptocurrency has been able to bottom an average of 312 days after its ATH crashes. In that sense, the analyst concluded:
The duration of 316 days in the current bear market so far is between 2011 and 2013 + 2017. Either we are falling fast or this time it will be different. The average duration from top to bottom is also very interesting. The average is 312 days, which is where #Bitcoin is now.


