
Bitcoin price is making a slight recovery on the chart. Although the coin has been consolidating in recent weeks, BTC has attempted an upward move. In the past 24 hours, the coin has registered an appreciation of 0.6%.
Looking at the weekly progression, BTC is stuck between two price levels of $16,400 and $16,900 respectively. Judging by the technical outlook, the coin has been portraying positive sentiment, with buyers slowly returning to the market.
It also formed a bullish pattern on the daily chart, meaning that the price might recover in the coming trading sessions. Accumulation appeared on the chart, which meant there was a demand for the coin over the past trading sessions.
BTC has also formed a double bottom pattern, which is a chart pattern that resonates with an upcoming major move for the king coin. Currently, Bitcoin is trading 76% below its all-time high, which was secured over the past year. BTC’s market cap also recorded an increase, indicating increasing bullish strength.
Bitcoin Price Analysis: One Day Chart
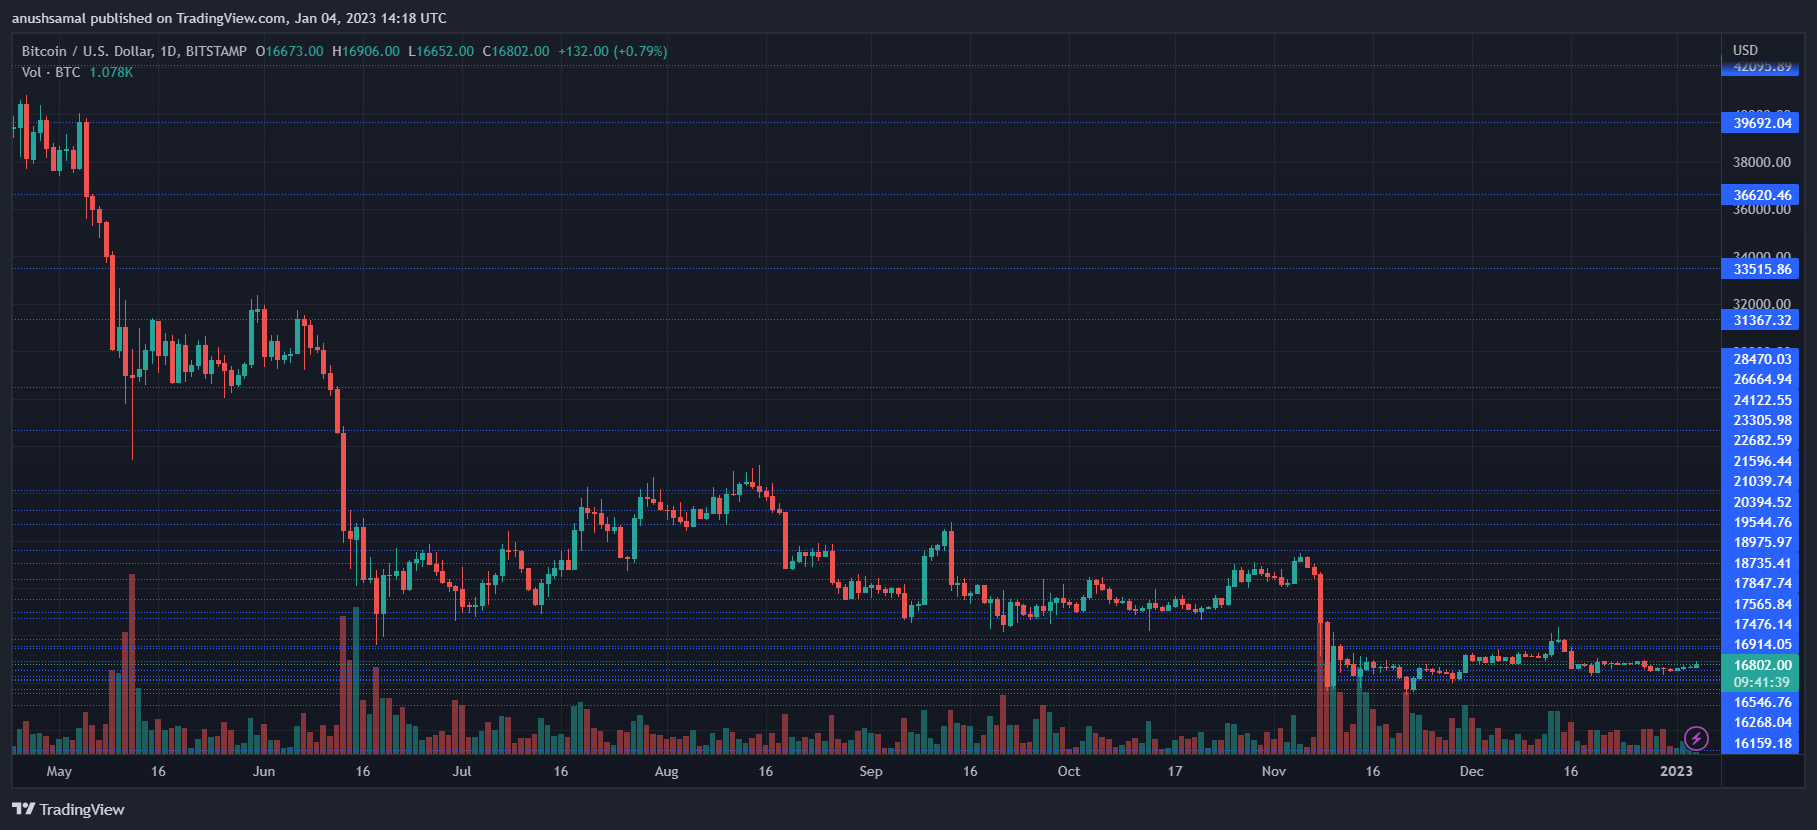
BTC was trading at $16,800 at the time of writing. The coin crossed the $16,800 mark as demand soared. Overhead resistance for Bitcoin hit $17,000. The double bottom formed by Bitcoin could cause the coin to rally and move above $17,000.
On the other hand, if Bitcoin slides from its current price level, the support zone for the coin stands at $16,400. A drop of $16,400 will drag the price to $16,100. The amount of BTC traded in the last session was green, meaning the coin entered a bullish zone.
Technical analysis
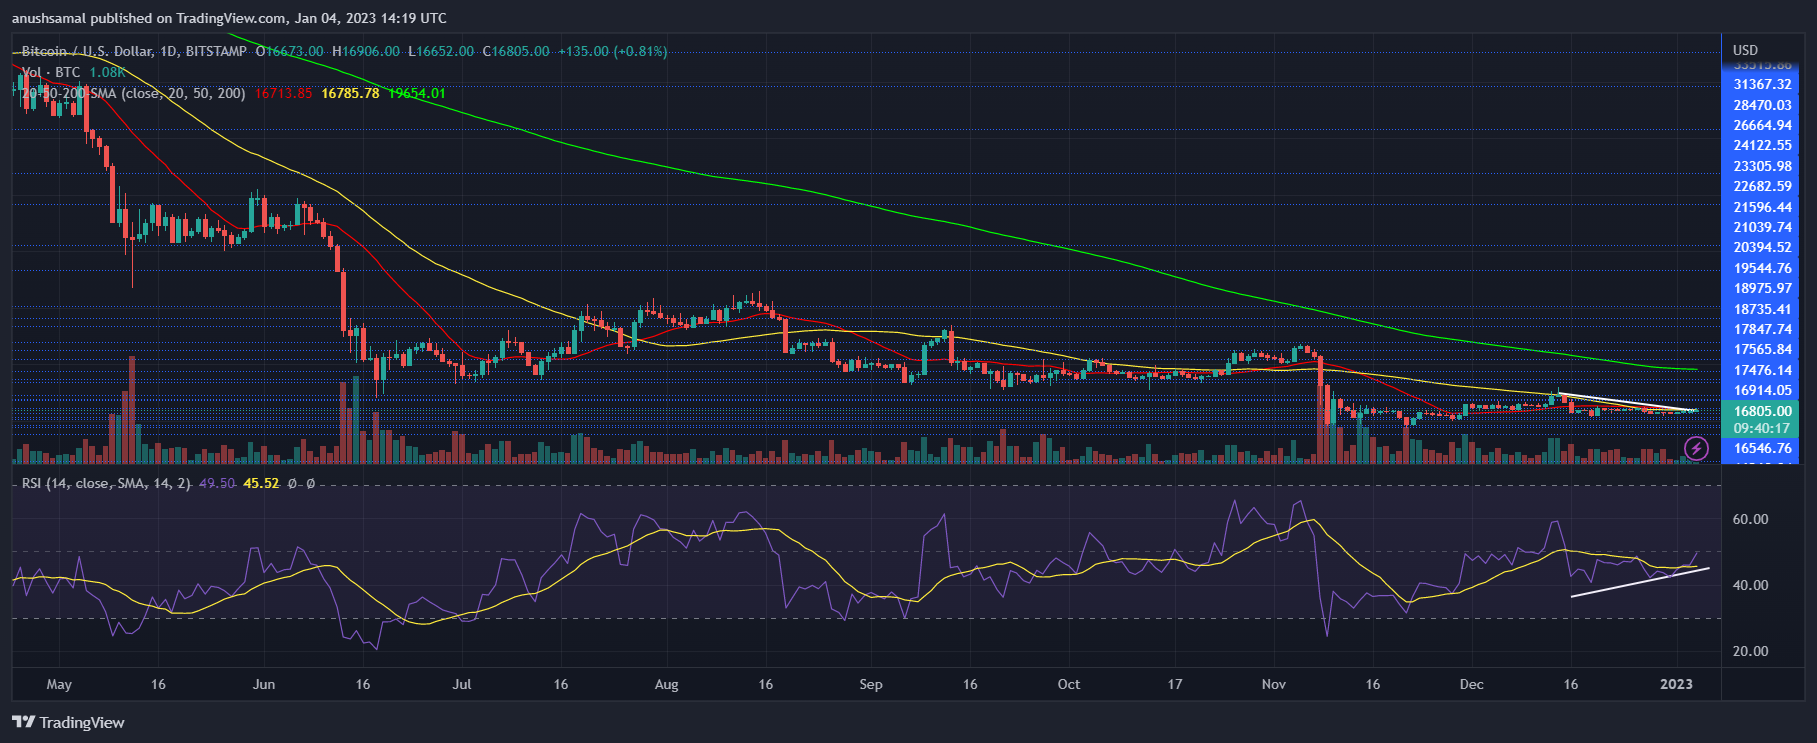
The demand for Bitcoin has increased in recent trading sessions. The Relative Strength Index (RSI) moved closer to and touched the half line, registering an increase in buyers. The RSI also formed a bullish divergence (white), which is a sign of positive price action.
Similarly, Bitcoin price rose above the 20-Simple Moving Average line, which meant that buyers drove the price action in the market. A move above the 50-SMA will cause the BTC price to trade above USD 17,400.
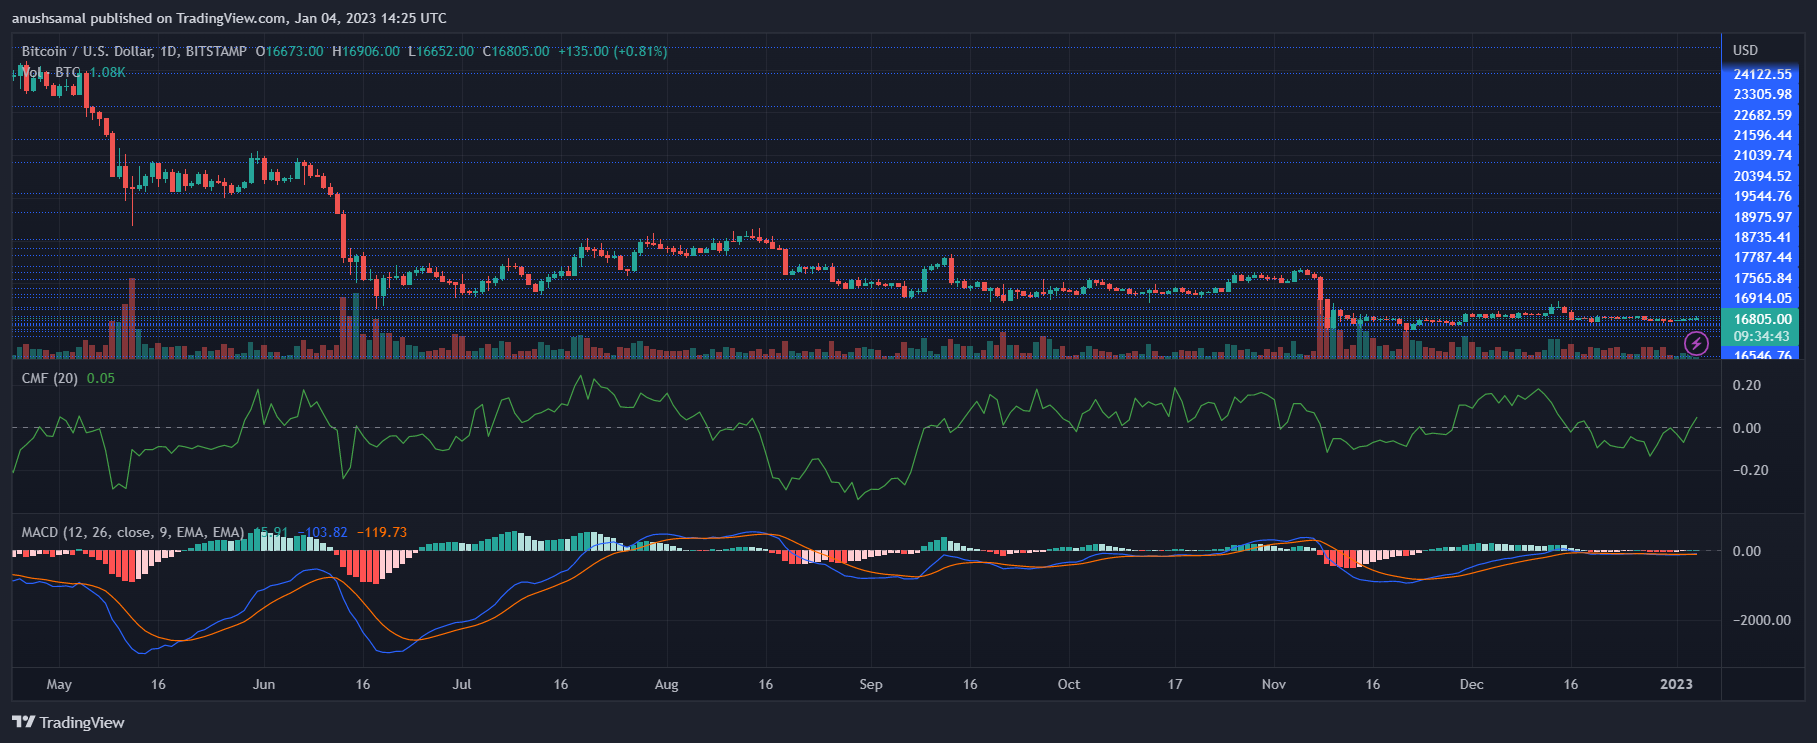
With regard to bullishness, other technical indicators have also sided with incoming bullish strength. The Chaikin Money Flow (CMF), which indicates the inflow and outflow of capital at a given point in time, registered a positive movement.
CMF was positive and above the half line, reflecting an increase in capital inflows. The Moving Average Convergence Divergence (MACD) is responsible for reading price momentum and reversals thereof. MACD demonstrated green histograms, which were buy signals for the coin. This meant that Bitcoin could anticipate a price increase.
Related reading: Ethereum Stakers in huge loss as 80% of ETH staked is in the red
Featured image from UnSplash, charts from TradingView.com


