
Using past trends of the Bitcoin-adjusted Spent Output Profit Ratio (aSOPR), a quant has explained whether the current cycle has already met all the bottom conditions.
Bitcoin aSOPR EMAs Approaching Golden Cross
As one analyst explained in a CryptoQuant post, the aSOPR EMAs are looking to form a golden cross soon. The “Spent output profit ratio(SOPR) indicates whether the average Bitcoin investor is currently selling at a profit or loss.
The “SOPR modified(aSOPR) is a modified version of this metric that excludes all sales made within an hour of the initial purchase of the coins from the data. The advantage of this is that such short-term transactions are noise in the data and thus have no significant impact on the market.
When the value of this indicator is greater than 1, it means that the holders are currently selling coins with some profit. On the other hand, values below the threshold suggest that the overall market is currently experiencing some loss.
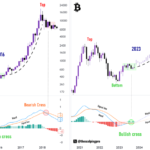
Of course, if the aSOPR is exactly equal to 1, it means that the investors are just breaking even on their current sales. Here is a chart showing the trend in the Bitcoin aSOPR, as well as the 50-day and 100-day exponential moving averages (EMAs) during the 2014-2015 and 2018-2019 bear markets:

The trends in the metric during the previous bear market bottoms | Source: CryptoQuant
As shown in the chart above, the quant marked the relevant zones for the indicator in the previous two cycles. It appears that the aSOPR reached bottoms below one and then went on an overall uptrend as the price of Bitcoin itself bottomed out in both cycles. The indicator falling below such a low level suggests that investors capitulated heavily at the time, ridding the market of weak hands and helping the price finally bottom out.
Also, the 100-day EMA fell to the same low in both bear markets (as shown by the bottom dotted line in the chart) and then recovered from it when this bottoming process occurred. It also appears that a return to a bullish trend started with a golden cross of the two EMAs, with the 50-day cross back above the 100-day mark.
Here’s a chart showing how the aSOPR and its EMAs are looking so far in the current cycle:

The value of the metric seems to have been climbing recently | Source: CryptoQuant
The chart shows that the same pattern of the Bitcoin aSOPR forming a bottom and then catching an overall uptrend has already appeared for the current cycle. The two EMAs are also on track to complete the gold cross soon.
However, the analyst has pointed out that the 100-day EMA has yet to reach the dotted level in this cycle. The period spent so far on the metric’s recovery (the uptrend from the bottom) has also been only about half of what previous cycles saw (the yellow bars).
Based on this, the quant believes that another price drop may follow, before these conditions are met and the real one bottom is in.
BTC price
At the time of writing, Bitcoin is trading around $17,200, up 3% over the past week.

Looks like BTC has sharply surged | Source: BTCUSD on TradingView
Featured image by Dmitry Demidko on Unsplash.com, Charts from TradingView.com, CryptoQuant.com


