
A quant has explained how this bearish divergence in Bitcoin on-chain data could lead to a short-term correction in the price.
Bitcoin Short-Term Holder SOPR Slows Despite Rising Price
As explained by an analyst in a CryptoQuant after, a gap has emerged in the purchasing power of short-term holders and the BTC price. The relevant indicator here is the “Spent output profit ratio(SOPR), which tells us whether investors in the Bitcoin market are currently selling their coins at a profit or loss.
When the value of this metric is greater than 1, it means that the overall market is currently making some profit. On the other hand, values below the threshold suggest that the average holder is currently seeing some loss. Of course, the indicator exactly equal to 1 implies that the investors just broke even on their investment.
The “short term holder(STH) group is a Bitcoin cohort that includes all investors who purchased their coins less than 155 days ago. The STH SOPR thus measures the profit ratio of sales by these holders. To properly assess the behavior of this group, the analyst uses a “rate of change” (ROC) oscillator for the indicator. Here’s a chart comparing this momentum oscillator to BTC price over the past few months:
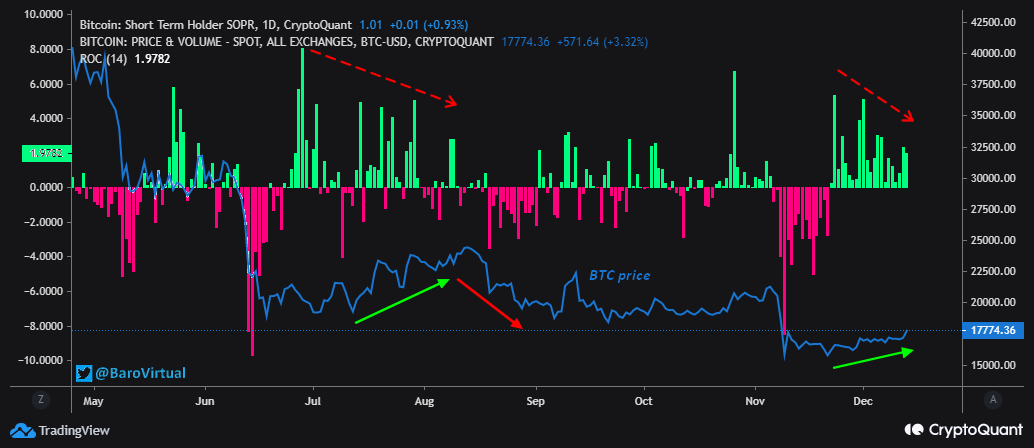
Looks like the metric has been going down in recent days | Source: CryptoQuant
As the chart above shows, the ROC of the Bitcoin STH SOPR was deep red when the FTX crash took place, suggesting that these investors capitulated during the fair and suffered a major loss. However, as the BTC price has slowly improved from the lows, the ROC has turned green. This implies that the STHs that bought during the lows sold at a profit, leading to a rising SOPR.
Bitcoin has continued to see an upward trend lately, but oddly enough, the STH SOPR ROC is declining. This could be a sign that not many STHs were able to buy during these lows, suggesting that their buying power is low right now. Had they bought through this rally, they would have been making more and more profits as the price rises, but that has clearly not been the case.
Such a divergence also formed in the relief rally seen earlier in the bear market, as the quant has indicated on the chart. “Last time, this situation led to a bearish correction,” the analyst notes. “If this alignment repeats, Bitcoin could correct to the $16,500 – $17,000 range this time.”

BTC surges up | Source: BTCUSD on TradingView
At the time of writing, Bitcoin’s price is hovering around $17,700, up 5% over the past week.


