
Bitcoin price remains hovering just below $19,000 at the time of writing, not far from the local low of $18,300. When the Consumer Price Index (CPI) and Producer Price Index (PPI) data was released last week, BTC price plunged to exactly that price level.
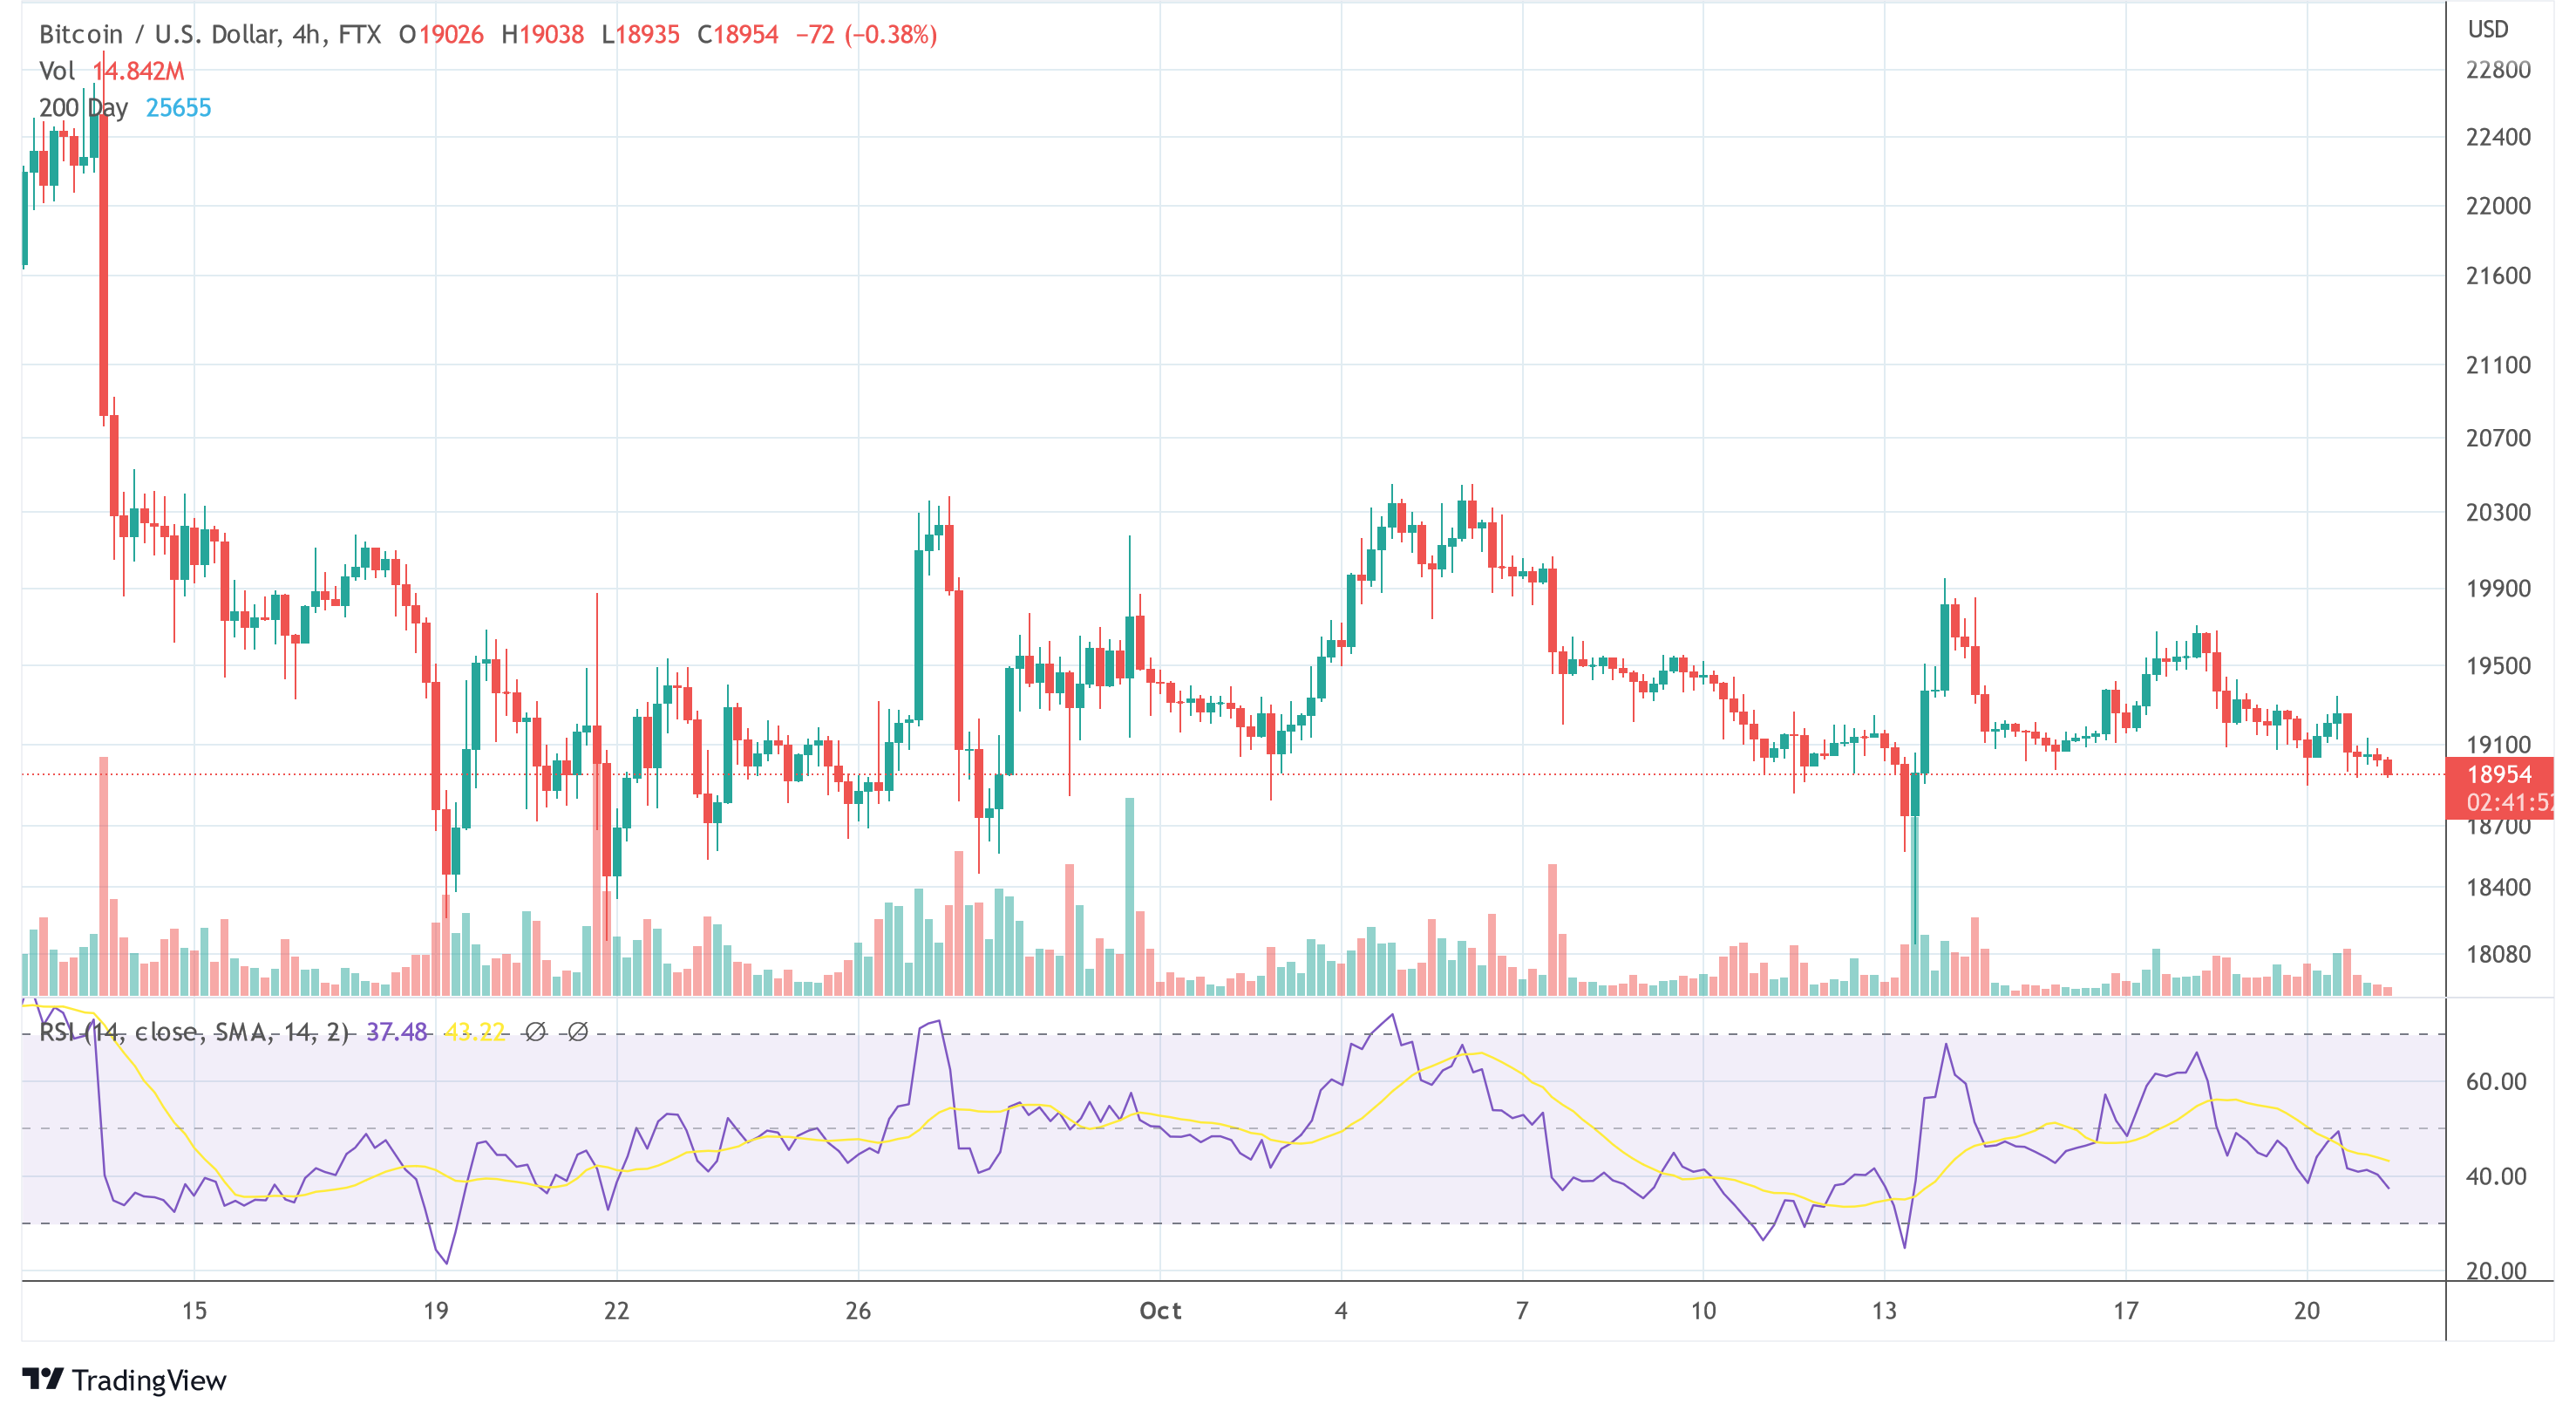
Unexpectedly for many, a very quick rebound happened, with the shorts caught off guard. With 02 November – when the FEED coming back together – in mind Bitcoin price does not have much room to fall below that level right now. In addition, a look at the chain suggests that another crash is possible in the near term, although there are positive signs as well.
According to for CryptoQuant, a bear market signal appears when the realized price of all long-term holders (blue line) moves above the realized price of all coins purchased (red line) and when the BTC price falls below the realized price of long-term holders and the realized price of all coins.
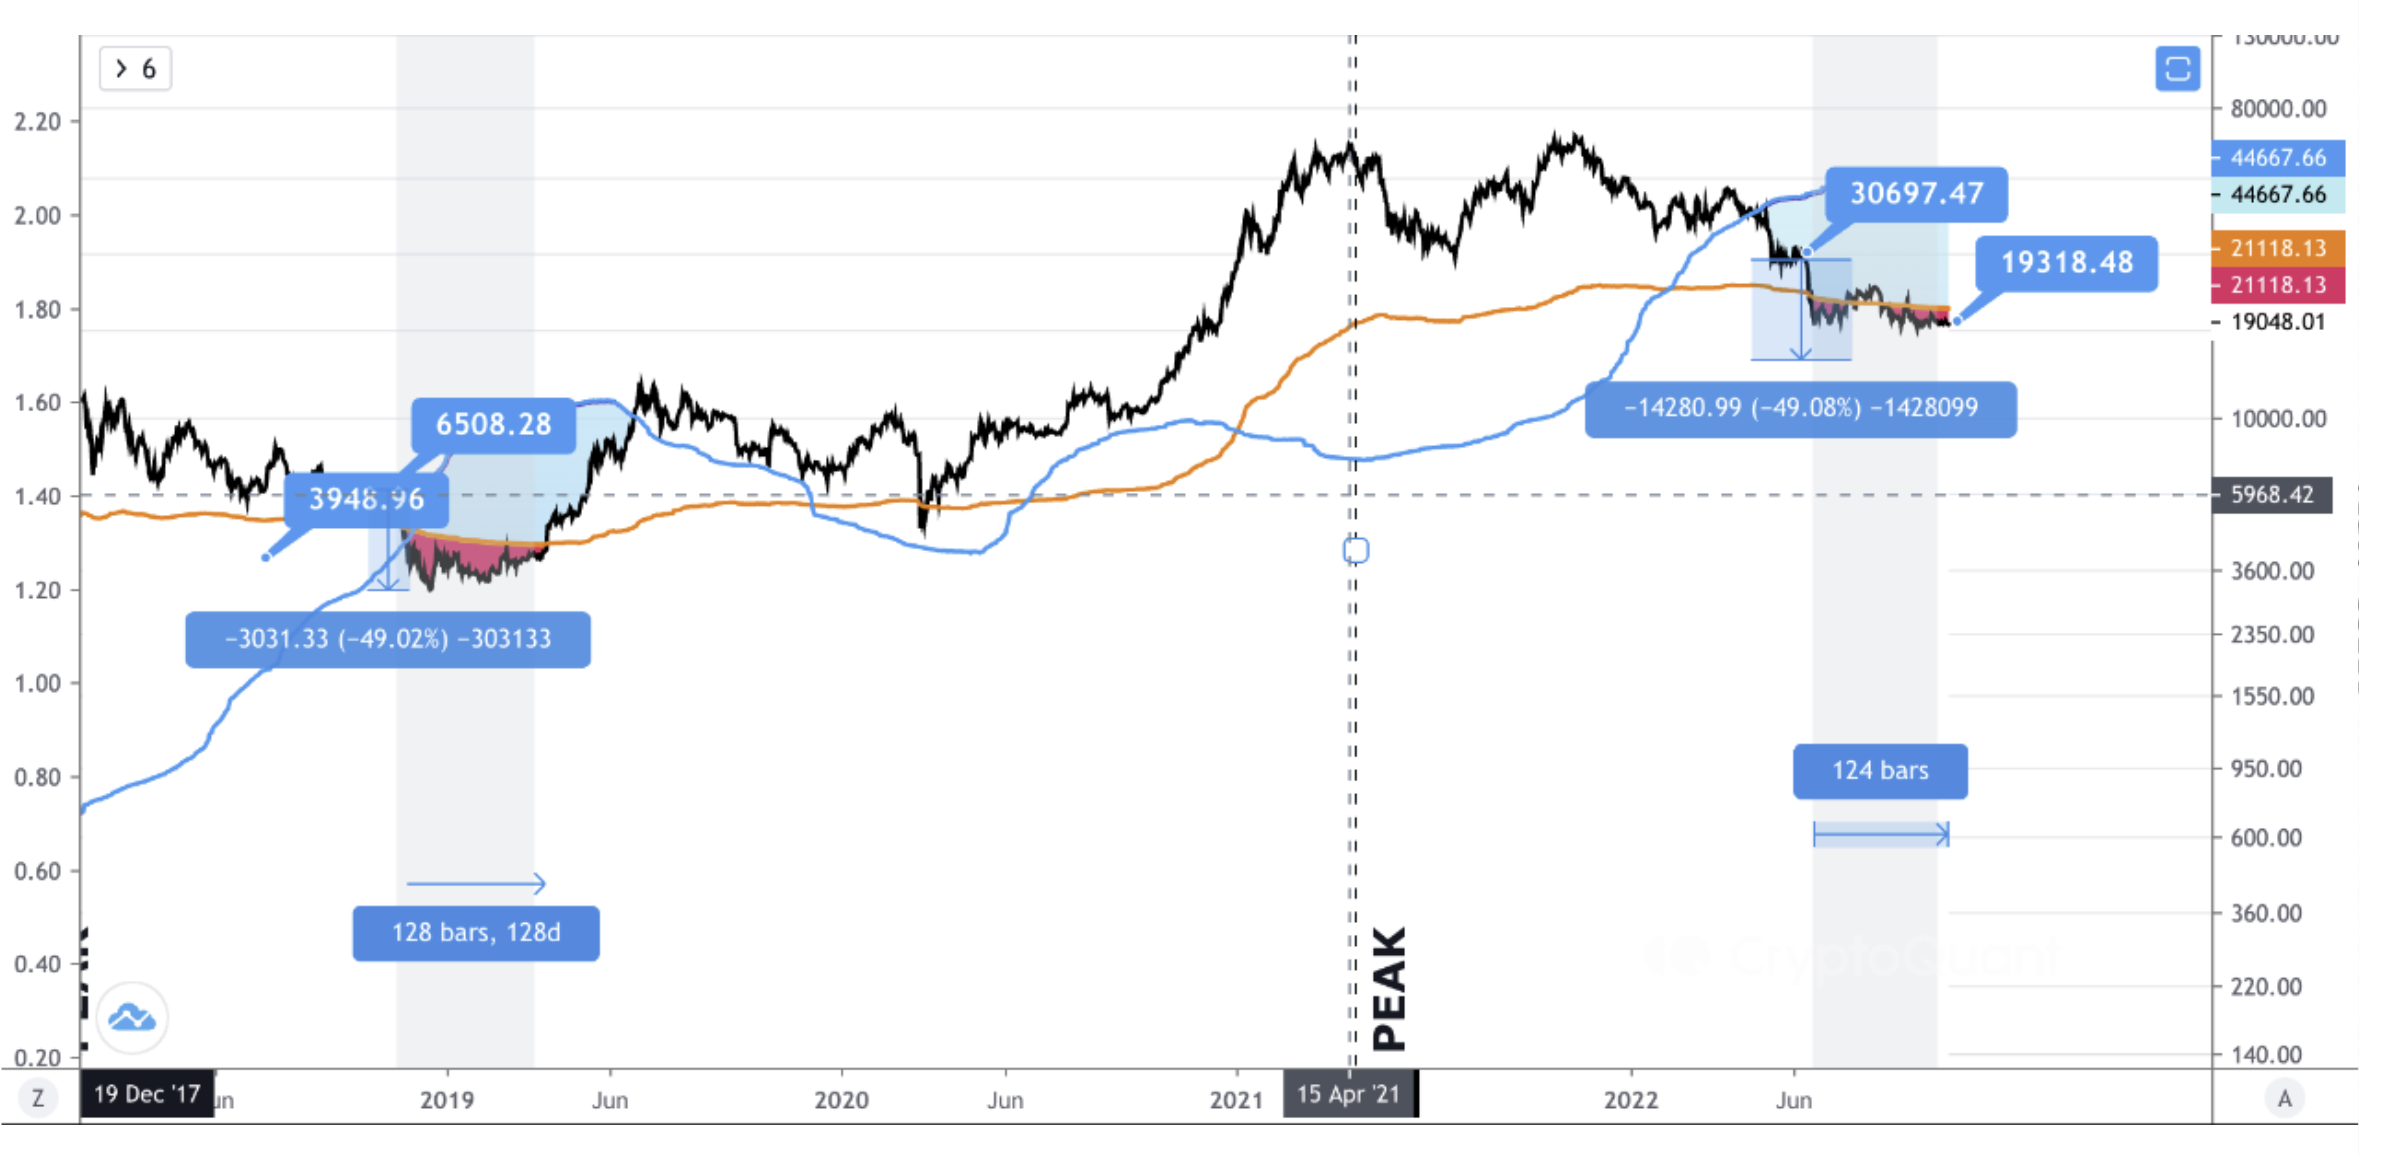
The analysis concludes that Bitcoin price has been in a bear market for 124 days. In this regard, the drop from $6,000 to $3,000 is similar to the price drop from $30,000 to $18,000, as the percentage drop in the last bear market from $6,000 to $3,000 was 50%.
That said, the bottom may not have been seen yet:
The drop from $30.7k to $18.2k was 41%. A 50% drop from $30.7k would bring BTC to $15k (-18% of its current price). Similar to the $14.7k delta price.
Conflicting on-chain data for Bitcoin
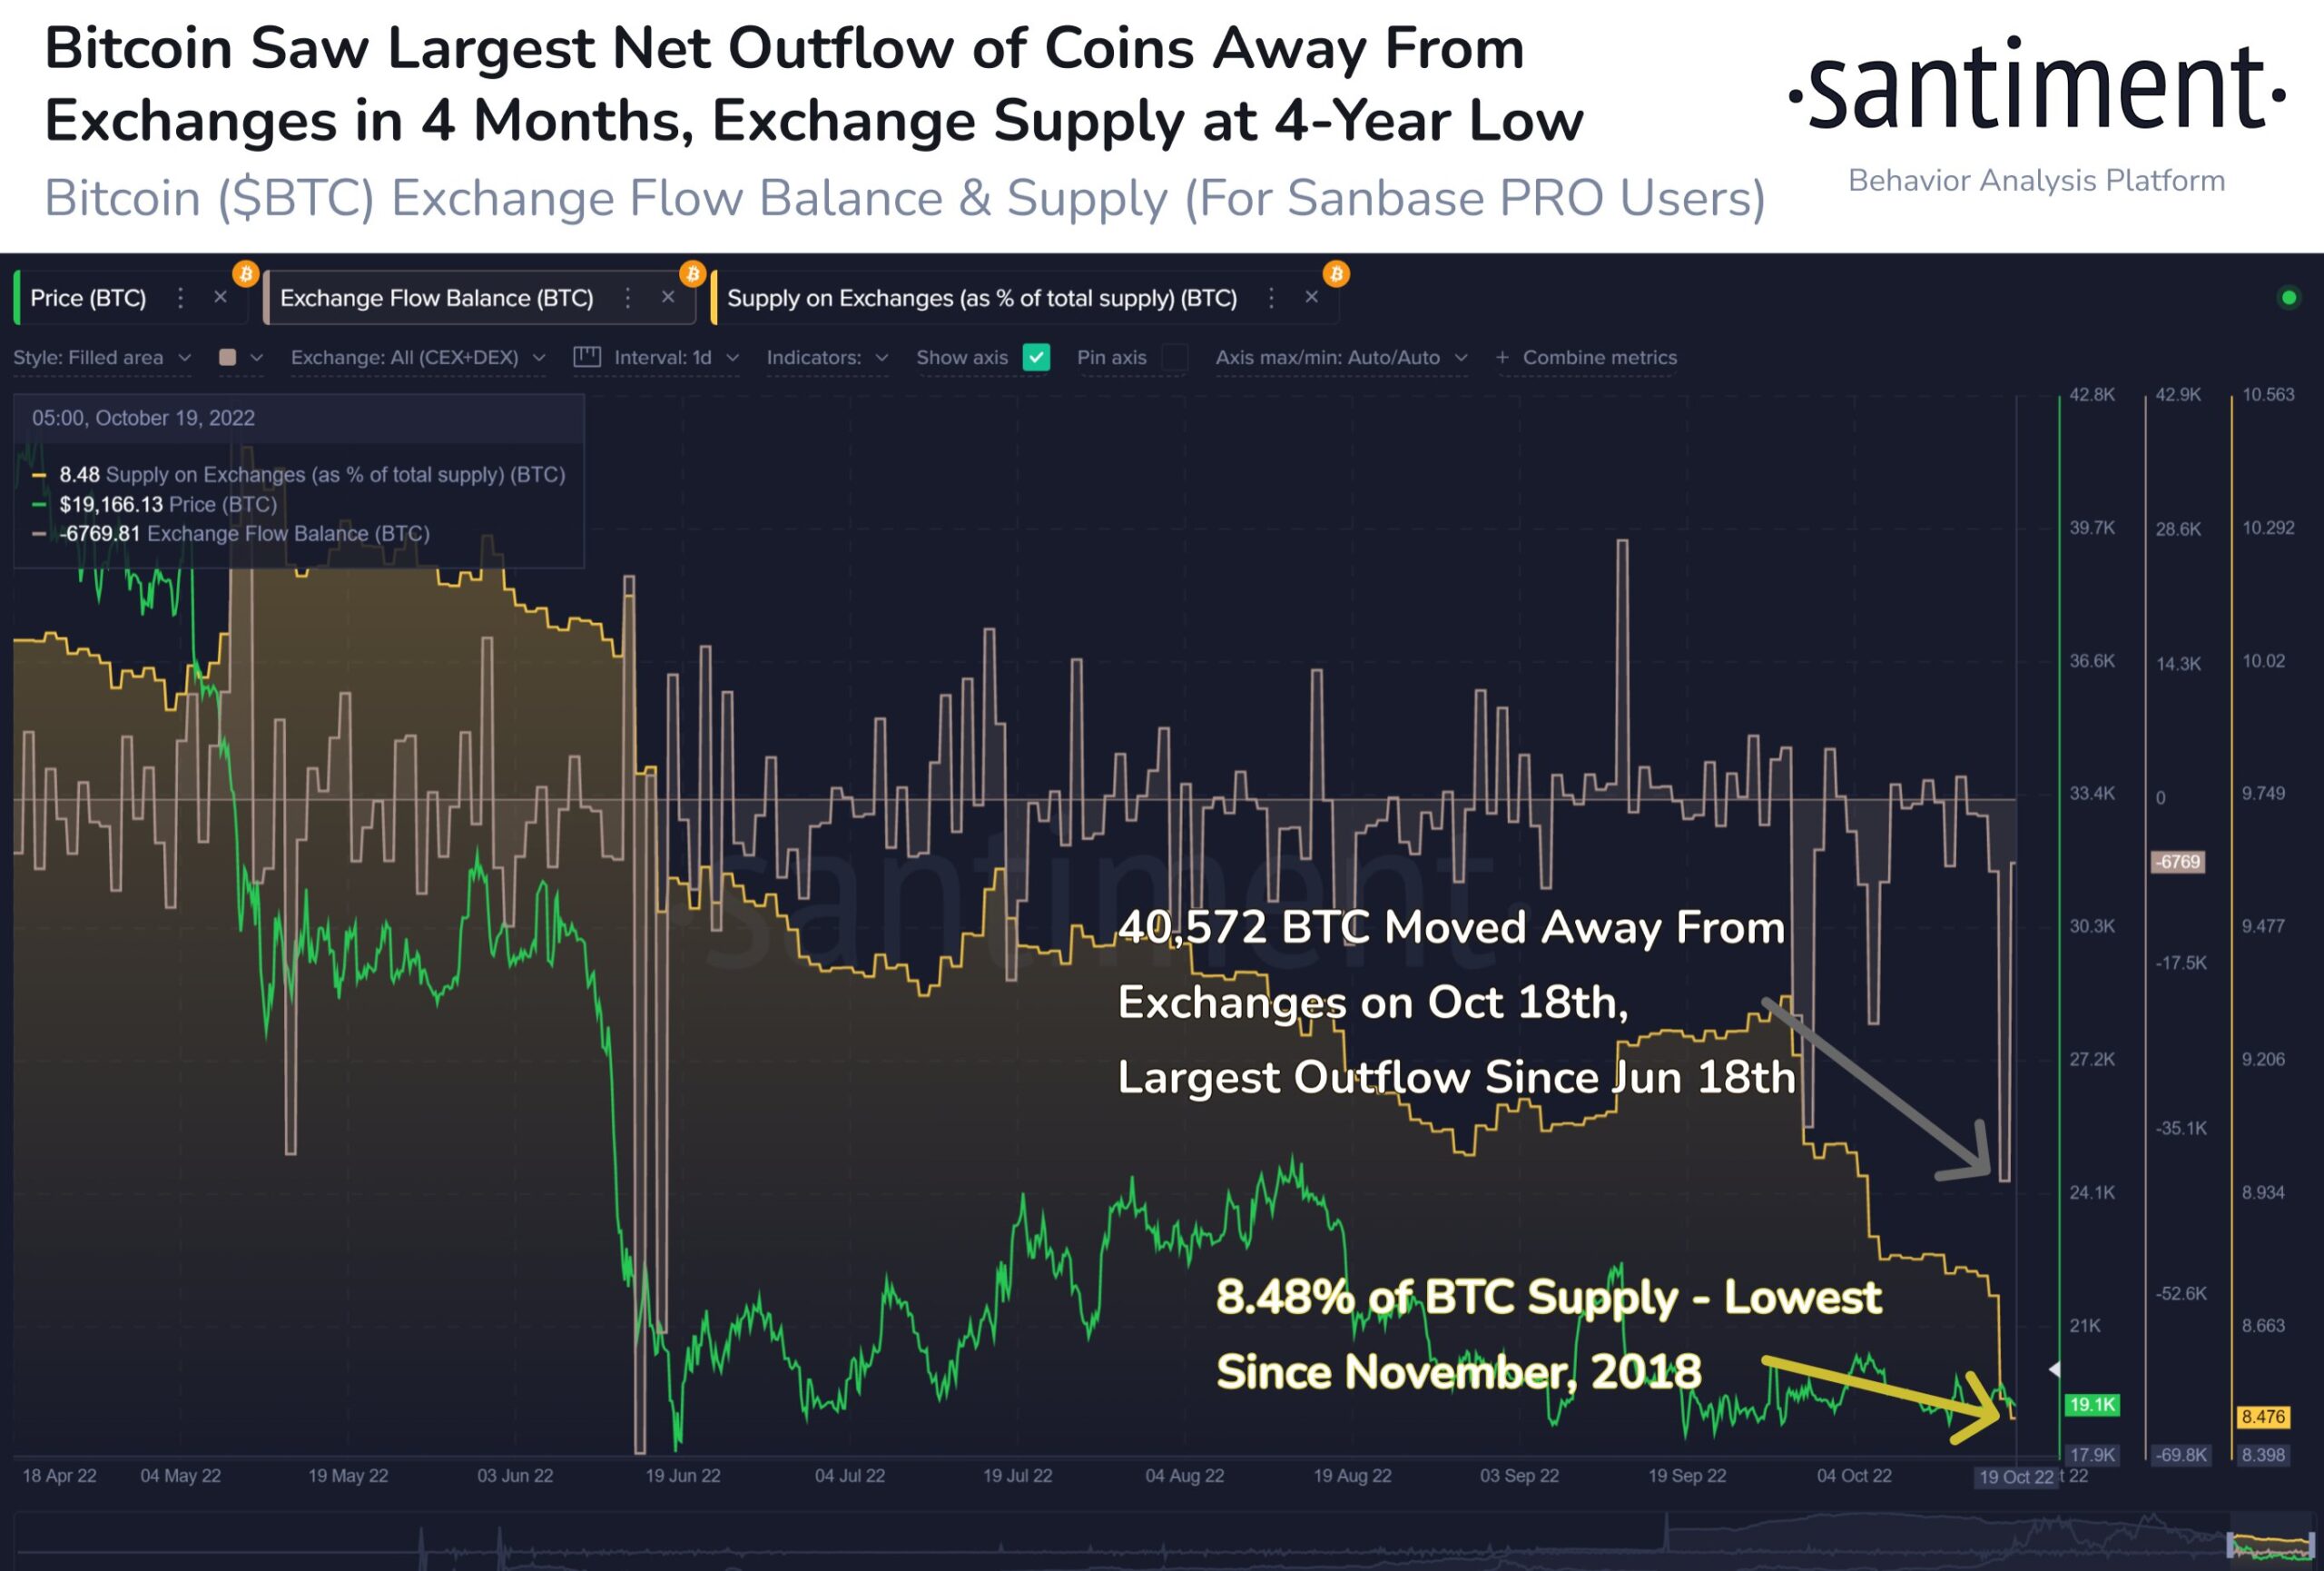
With Santiment, another major on-chain analysis service stated that the Bitcoin market should ideally see accumulation at this point, while small traders remain bearish and spread doom and gloom.
However, conflicting data emerge in this regard. For example, Bitcoin’s small to medium addresses (with 0.1 to 10 BTC) recently hit a record high of 15.9% of available supply. At the same time, whales with 100 to 10,000 BTC have registered a 3-year low of 45.6% of the supply.
On the bullish side, Bitcoin saw a massive outflow of coins from exchanges on October 18. Santiment registered the largest daily volume in 4 months at 40,572 BTC. With this, the supply of coins on all exchanges has fallen to 8.48%. This means that the risk of a future sell-off has at least somewhat decreased.
Bullish data is also reported by the third major on-chain data provider Glassnode. Bitcoin offer which has not moved for the past 6 months is approaching an all-time low. It currently stands at 18.12% of the circulating supply or about 3,485 million BTC. glass node writes:
Historically, very low volumes of mobile offerings typically occur after prolonged bear markets.
Jim Bianco, President of Bianco Research LLC, recently quoted an old trader’s adage, “Never short a dull market”, which may apply to the Bitcoin market more than ever.
According to his analysis, it is realized volatility, which means that the backwardation or actual volatility is at its lowest level in two years, registering one of the all-time lows.
Markets bottom on apathy, not excitement. BTC and ETH have apathy. The S&P 500 is almost the opposite as prices move like a video game. This can also be another sign of the breaking of the TradFi/Crypto tight relationship. If so, this is bullish for crypto in the long run.
Divergent volatility can therefore be a sign of this shift and ultimately lead to a positive long-term trend.


