The cryptocurrency market has been on a roller coaster ride in recent months, with Bitcoin and Ethereum prices experiencing significant volatility. After a period of relative stability, the price of BTC surged a remarkable 28% in January, leading to liquefaction worth over $500 million as exchanges closed out traders’ leveraged short positions.
However, some experts are warning that the sudden jump in the price of BTC may not be a sign the bull market is returning And this could be a bitcoin bull trap.
Bitcoin (BTC) Price Prediction and Technical Analysis: Bitcoin Bull Trap?
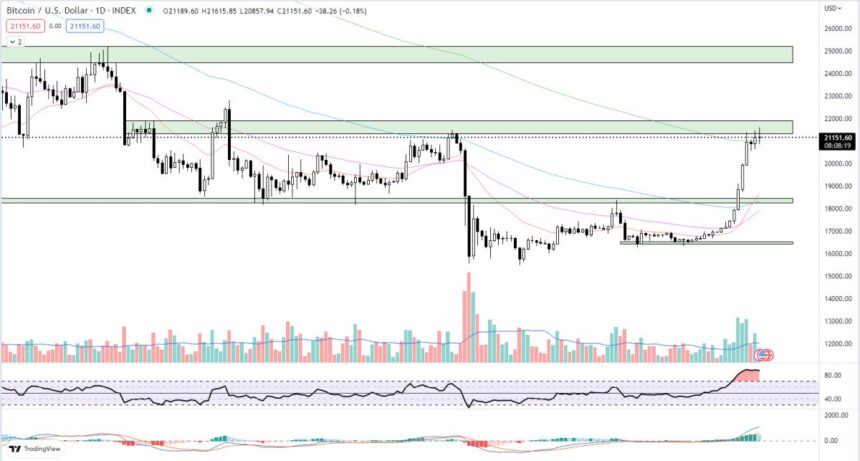
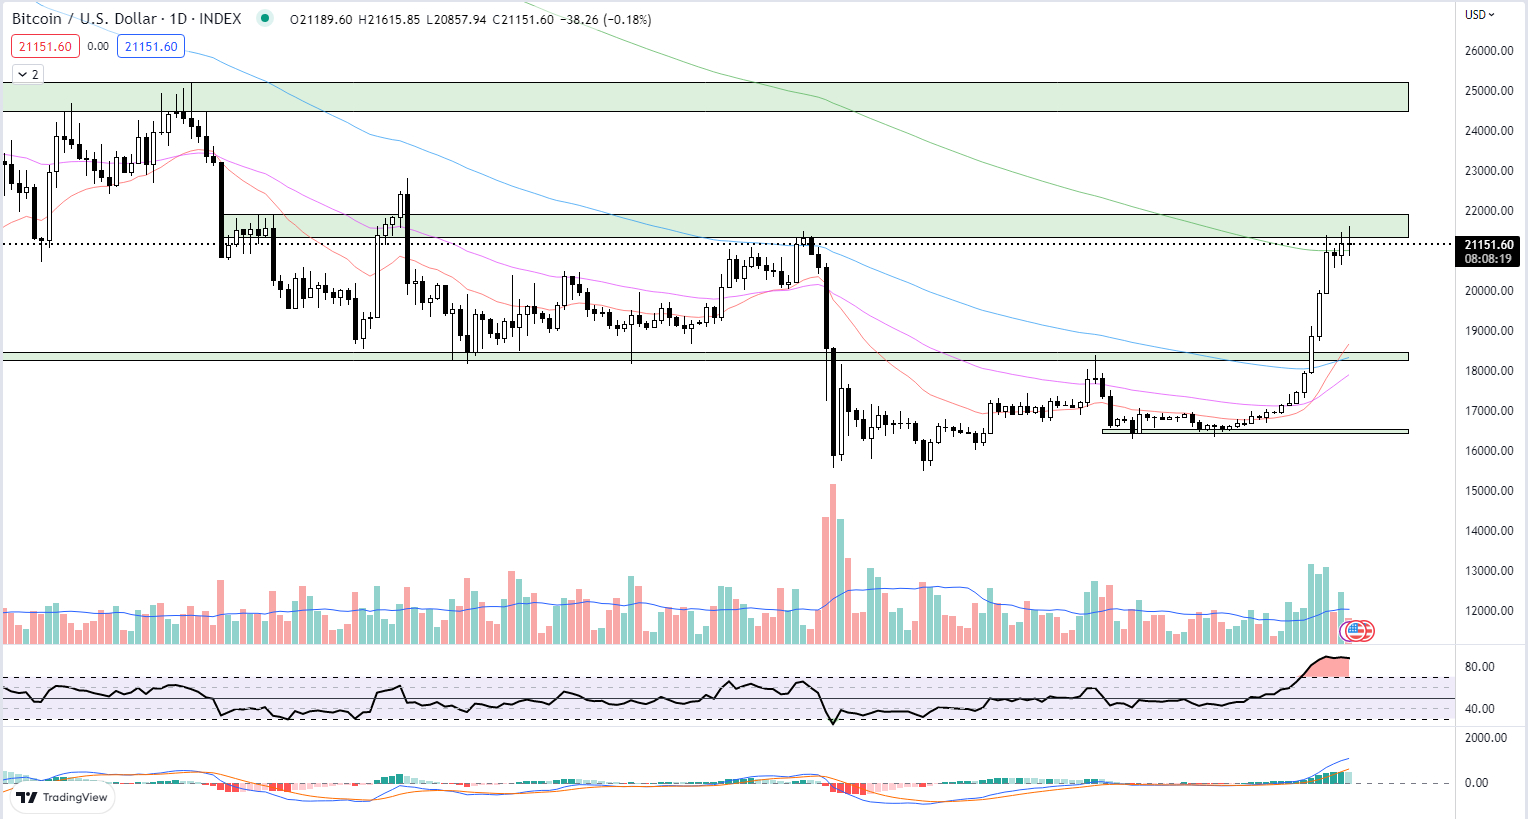
An important technical indicator to consider is the 200-day EMA, which is widely used to gauge broad market trends. When BTC price is above the 200-day EMA, it is considered to be in a bullish market trend, and when it is below, it is considered to be bearish.
Bitcoin has been consolidating around the 200-day EMA for the past four days after trading below its 284-day low, before closing above the key level yesterday. It is worth noting that the last time bitcoin price bounced above this level was back on March 27 to April 6, 2022, when the market experienced a false breakout.
In view of this, traders are advised to wait for confirmed breakout and bullish EMA alignment before entering positions cryptocurrency market Currently, and also to exercise maximum risk management.
The 20-day, 50-day, and 100-day EMAs of BTC are currently at $18,660, $17,885, and $18,317, respectively. This suggests that the short to long term trend is bullish, as the price is currently above all three EMAs, a promising sign that we may get the above breakout if broader macroeconomic factors permit.
The trading volume for bitcoin currently stands at 22,316K with a volume moving average estimated at 31,547K. With a few more hours left in today’s session, it looks like bitcoin trading volume will exceed its recorded average – a sign of high investor interest. cryptocurrency,
With an RSI reading of 88.91, it is possible that this could be an uptrend due to retracement and consolidation before further upside. However, to ensure that traders get the best out of this data during an uptrend, it is ideal to use multiple indicators along with the RSI for more accurate readings. Traders should keep an eye on volume support and look for any divergence that could potentially indicate that the current trend is weakening and could be a bitcoin bull trap.
The MACD is also showing bullish signs, however, further confirming a possible sustained bullish move. The MACD is at 1069.59, the Signal Line is at 593.41, and the Histogram is at 476.51. This suggests that the upward momentum is likely to continue.
the current bitcoin price to $21,151 with a daily loss of 0.18%. Immediate support is near the 200-days EMA at $21,000 and $20,500 price levels. The immediate resistance levels lie at $21,302 to $21,895 and the next resistance lies at $24,445 to $25,212.
Bullish Trend May Continue But Be Careful to Avoid Bitcoin Bull Trap
It is still uncertain whether the current rise in price and sentiment for bitcoin is the beginning of a returning bull market or a bitcoin bull trap. While there has been a significant increase in the value and volume of trade, Liquidity hasn’t fully recovered since the collapse of FTX And the depth of the market is starting to sink again. Additionally, recent legal troubles for crypto lender Genesis and exchange Gemini could also impact the market. Further market observation is needed to determine whether this is a sustainable trend or a temporary spike.
In conclusion, technical indicators suggest that bitcoin is currently in a strong bullish trend and that its upward momentum is likely to continue in the near term if macroeconomic factors permit. However, the RSI and other fundamental data suggest a possible reversal in the near future, so investors should exercise caution and watch the market closely to avoid bitcoin bull traps.
More Read

Bitcoin Crypto Related Post


