
On-chain data shows Bitcoin is now trading 24% below its realized price, here’s how much deeper the crypto went during historical cycles.
Bitcoin is down 24% below its realized price so far
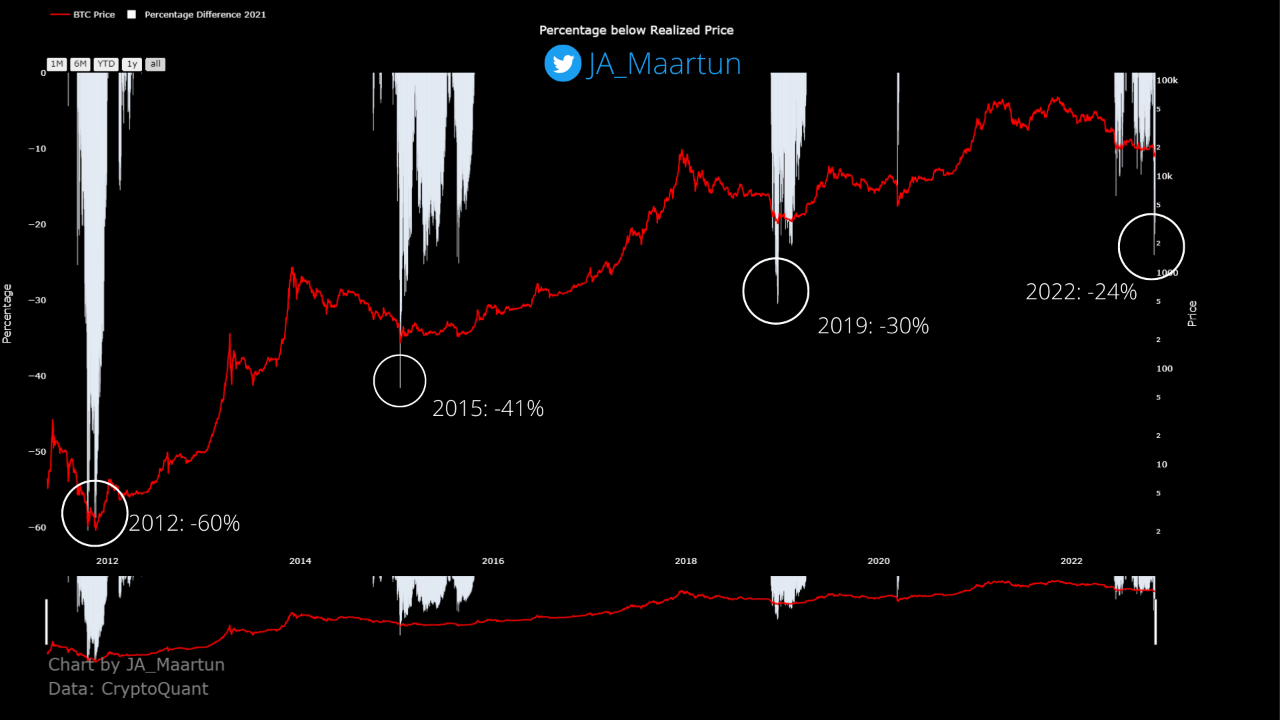
As noted by an analyst in a CryptoQuant afterwithdrawals fell below realized price with each cycle.
A popular capitalization model for Bitcoin is the “realized capwhich measures the limit by weighing each coin in the circulating supply at the price at which it last moved.
This is different from the usual market cap, where each coin in circulation is simply multiplied by the latest BTC price.
Now, from this realized cap, a “realized pricecan be derived by dividing the metric by the total number of coins in circulation.
The usefulness of this price is that it indicates the cost base of the average holder in the Bitcoin market. This means that when the normal price drops below this indicator, the average investor enters a state of loss.
Here is a chart showing the percentages below the realized price that BTC has fallen during each cycle:
Looks like the value of the metric has plunged in recent days | Source: CryptoQuant
As you can see in the chart above, the latest crash in Bitcoin’s price has pushed the crypto 24% below its realized price, the deepest value seen so far in the current cycle.
The chart shows that the previous bear market of 2018/19 had an even bigger drop as the price had fallen about 30% below the metric on the downside.
Comparing the two cycles separately would indicate that the current bear market has yet to see a significant drop before reaching the same bottoms.
However, things change when the bottoms of 2015 and 2012 are also taken into account. In 2012 Bitcoin went as much as 60% below its realized price, while in 2015 the drop was around 41%.
There seems to be a pattern here, and it is that the percentage drop below the indicator has become smaller with each cycle.
In fact, if this trend continues this time around, Bitcoin may already be close to a bottom for this cycle.
BTC price
At the moment of writing, The price of Bitcoin floating around $16.5k, down 1% over the past week. Over the past month, the crypto has lost 14% in value.
The chart below shows the trend in the coin’s price over the past five days.

The crypto continues to show stale price movement | Source: BTCUSD on TradingView
Featured image from Traxer on Unsplash.com, charts from TradingView.com, CryptoQuant.com


