
On-chain data shows that Bitcoin profit-taking has increased in the short term, will this lead to a correction in the price of the crypto?
Bitcoin Short-Term Holder SOPR has recently risen
As noted by an analyst in a CryptoQuant after, examples of the current trend have led to cryptocurrency price declines in the past. The relevant indicator here is the “Spent output profit ratio(SOPR), which tells us whether the average Bitcoin investor is currently selling their coins at a profit or loss.
When the value of this metric is greater than 1, it means that the holders as a whole are currently making some profit on their sales. On the other hand, values below the threshold suggest that the overall market is currently trending toward loss realization. Of course, if the indicator is exactly equal to 1, it means that the average holder is just breaking even with their distribution at this point.
One of the two main segments of the BTC market consists of the “short-term holders(STHs), a cohort that includes all investors who acquired their coins in the past 155 days. The holders who have sat on their coins for more than this threshold amount are called “long-term holders” (LTHs).
Here is a chart showing the trend in the Bitcoin SOPR specific to the STHs:
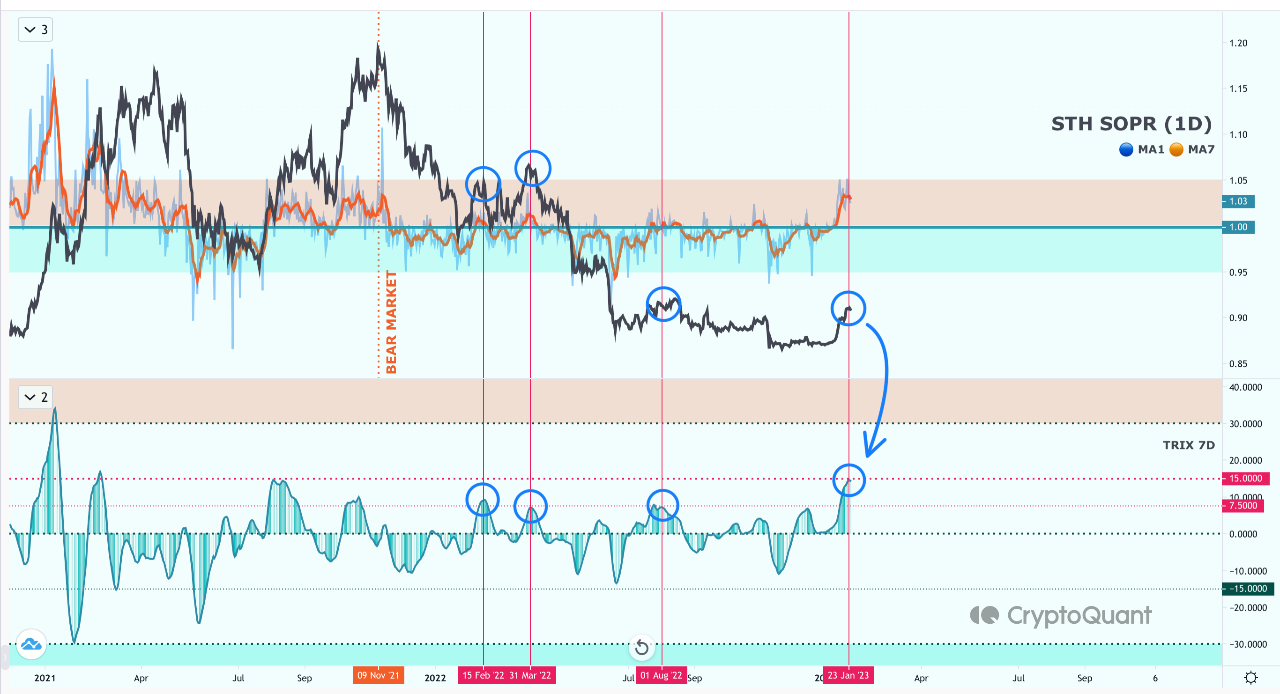
The value of the metric seems to have risen in recent days | Source: CryptoQuant
As shown in the chart above, the Bitcoin STH SOPR (as well as the 7-day moving average) has recently risen and broken above 1. This means that as the BTC rally has taken place, the STHs have made a profit and are now selling to reap these profits.
The chart also includes data for the 7-day triple exponential average (TRIX) of the STH SOPR. The TRIX is a momentum oscillator that shows the percentage change in a metric’s moving average after it has exponentially smoothed (hence the name) three times.
It can be seen from the chart that during this bear market, when the STH SOPR 7-day TRIX has reached a positive high, the price of Bitcoin has also noticed a local top formation and then dropped.
It appears that the STH SOPR’s 7-day TRIX has recently skyrocketed back up, and the metric now appears to be bending inwards, possibly heading for a top formation.
This pattern resembles the cases we saw in the bear market earlier, which could suggest that this Bitcoin rally will meet the same fate as the previous one. Although that would only be if the pattern completes and the indicator makes it to the top.
The analyst also posted the chart for the 2018-2019 bear market to see how the current rally compares to that of April 2019.

The trend in the STH SOPR 7-day TRIX in the 2018-2019 bear market | Source: CryptoQuant
Interestingly, the April 2019 rally only felt a short-term pullback from the first major spike in the indicator; it was not until the second peak that the price peaked. There have been some similarities between the current rally and that of April 2019 already, which could mean that the current one could also shake off this first spike in the indicator and continue its momentum just like the previous rally.
BTC price
At the time of writing, Bitcoin is trading around $22,900, up 5% over the past week.

BTC consolidates | Source: BTCUSD on TradingView
Featured image from Thought Catalog at Unsplash.com, charts from TradingView.com, CryptoQuant.com


