On-chain data shows that the Bitcoin taker buy/sell ratio has been unable to provide a real signal as of late as demand in the market has remained low.
Bitcoin Taker’s buy/sell ratio has failed to catch momentum lately
As noted by an analyst in a CryptoQuant afterthe taker’s buy/sell ratio hasn’t moved much above or below 1 since August 2022.Bitcoin taker buy-sell ratio” is an indicator that measures the ratio between the taker’s buying volume and the taker’s selling volume.
When the value of this metric is greater than one, it means that the buy or “long” volume is currently higher in the market. In effect, this means that there are currently more buyers willing to buy BTC at a higher price, and so the buying pressure is greater.
On the other hand, the values of the indicator below the threshold suggest that the buyer’s sales volume is currently more dominant. Such values imply a bearish sentiment currently shared by the majority of investors.
Of course, if the ratio is exactly equal to one, it indicates that the taker’s buying and selling volumes are exactly equal at the moment, which is why the market is evenly split between a bullish and a bearish mindset.
Now, here is a chart showing the trend in the 14-day simple moving average (SMA) Bitcoin taker buy/sell ratio over the past few years:
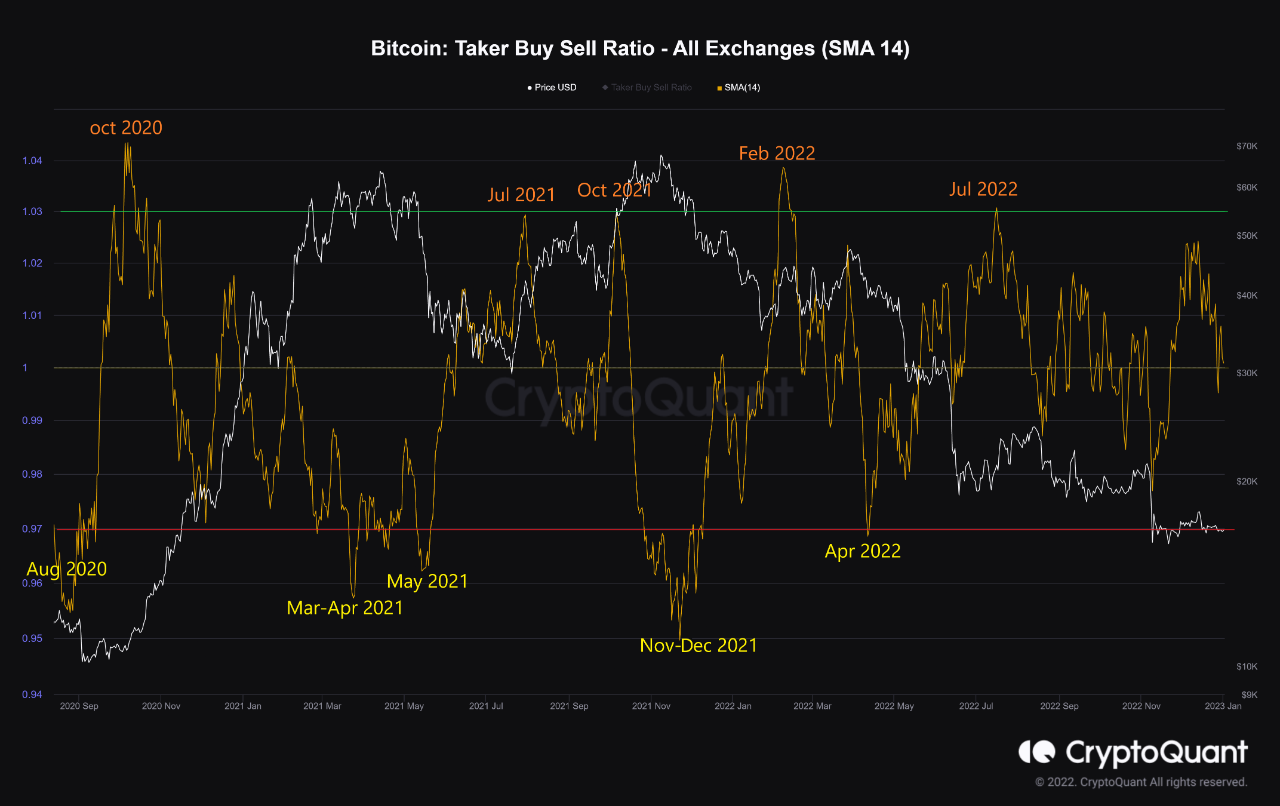
The 14-day SMA value of the metric seems to be close to 1 at the moment | Source: CryptoQuant
As you can see in the chart above, the quant has highlighted the relevant points of the trend for the 14-day SMA Bitcoin taker buy/sell ratio. It seems that when the indicator crossed the 1.03 level, BTC observed bullish momentum soon after.
On the contrary, whenever the ratio dipped below the 0.97 level, a bearish trend followed the price of the crypto. The last time this signal formed was in April 2022, before the market reached the LUNA and 3AC collapses.
The bullish signal was last seen in July 2022, as crypto built toward its first relief rally from the bear market. However, since then there have been no other breaches of any of these levels, as shown in the chart.
In the period between then and now, the taker’s buy/sell ratio has fluctuated around 1, but the metric just hasn’t been able to muster enough momentum to go either way. “We cannot expect Bitcoin to move much as long as confidence – and subsequently demand – does not return to the market,” the analyst explained.
BTC price
At the time of writing, Bitcoin is trading around $16,700, down 1% over the past week.

Looks like the value of the crypto has observed a small surge in the last 24 hours | Source: BTCUSD on TradingView
Featured image of Kanchanara on Unsplash.com, charts from TradingView.com, CryptoQuant.com


