
Bitcoin price made a 5% move today, taking it briefly above $19,000. It is currently the largest daily climb of 2023 and since the collapse of the FTX.
More importantly, the sharp rally marked a level that triggered a possible trend reversal according to the weekly Parabolic SAR. In the past, the technical indicator has lived up to its name. What could it mean this time?
Bitcoin makes the biggest move of 2023
The beginning of 2023 has been positive for altcoins. But to this day, Bitcoin has been mild in comparison.
Following the release of today’s CPI data at 6.5% and Biden’s victory lap on inflation, the price of Bitcoin surged by $1,000, pushing the top cryptocurrency briefly above $19,000.
More important than what happened today was what happened on the weekly time frame. BTCUSDT (Binance) weekly tagged the parabolic SAR for the first time since May 2022. The collapse of LUNA pulled Bitcoin and other cryptocurrencies lower, beginning the second, more aggressive phase of the recent downtrend.
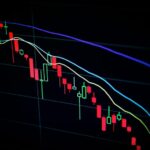
The same parabolic SAR signal was also triggered ahead of the 2019 crypto rally and the 2020 to 2021 bull run (pictured below). Both rallies previously also came from the same exact trendline.

The Parabolic SAR has produced profitable results | BTCUSDT on TradingView.com
BTCUSDT Triggers Weekly Parabolic SAR Buy Signal
The Parabolic SAR is a technical indicator designed by J. Wells Wilder, Jr. and is used to detect changes in trend direction. The tool consists of a visual overlay of SAR dots floating above or below price action, determining the direction of the trend.
When the SAR dots are tagged, it suggests that a trend could “stop and reverse” – which is exactly what SAR stands for. Therefore, it is especially effective in timing full and exits. Since the SAR dots move higher or lower along the trend, they can be reliably used to set trailing stop losses.
On weekly timeframes, BTCUSDT (Binance) hit the parabolic SAR, essentially telling short traders to get out of the position. If bears had been using the PSAR for trailing stop losses, they have now – on purpose – stopped taking profits.
While the signal is no guarantee of a sustained uptrend, given that the possible signal of a trend change has appeared alongside the coincidental timing of a prolonged trendline touch, the recovery from this level could be more sustainable than many are ready for.


