The SOL token, which powers the Solana smart contract ecosystem, is currently trading at $20.00, up 60% from its lowest price point in 2022, and up 30% from the lows experienced in March 2023. Which indicates a significant upward trend.
Solana Price Shows Resilience in an Imminent Rally
The prolonged crypto winter in 2022 and the tainted association of the ecosystem has caused Solana price to drop by almost 95%. FTX exchange, its founder Sam Bankman-Fried and Alameda Research bustedWhich was one of the major crypto market makers.
However, Solana has shown exemplary strength and performance in 2023, where it traded as high as around $27.00, although the coin pulled back in March, reversing the trend to trade slightly above $20.00 at the time of writing. Testing support at $16.00 before.
Experts believe that Solana’s performance dates back to December, when the token became largely oversold, prompting investors to buy the dip. On-chain and fundamental data from Messari showed that the Solana ecosystem remained generally stable during the chaotic collapse of FTX, including its staking and decentralized finance (DeFi) positions.
“Solana will continue a number of initiatives, including network upgrades, ecosystem development and community efforts,” James Stottman, a researcher at Messari, said in the report about Solana’s performance.
Stoutman’s statement implied that the market may have reacted to the FTX implosion, which led to a sharp jump in Solana’s price in 2023 by the typically upward trending crypto market.
“After a difficult year filled with one challenge after another, light appears to be at the end of the tunnel in 2023,” Stottman said.
Meanwhile, Solana price is preparing for another major breakout based on its technical outlook, as seen on the four-hour time frame charts. The support at $20.00 appears to be strong enough to sustain the uptrend, especially now that SOL is facing resistance at the 50-day exponential moving average (EMA) (red colored line), which is at $20.72.
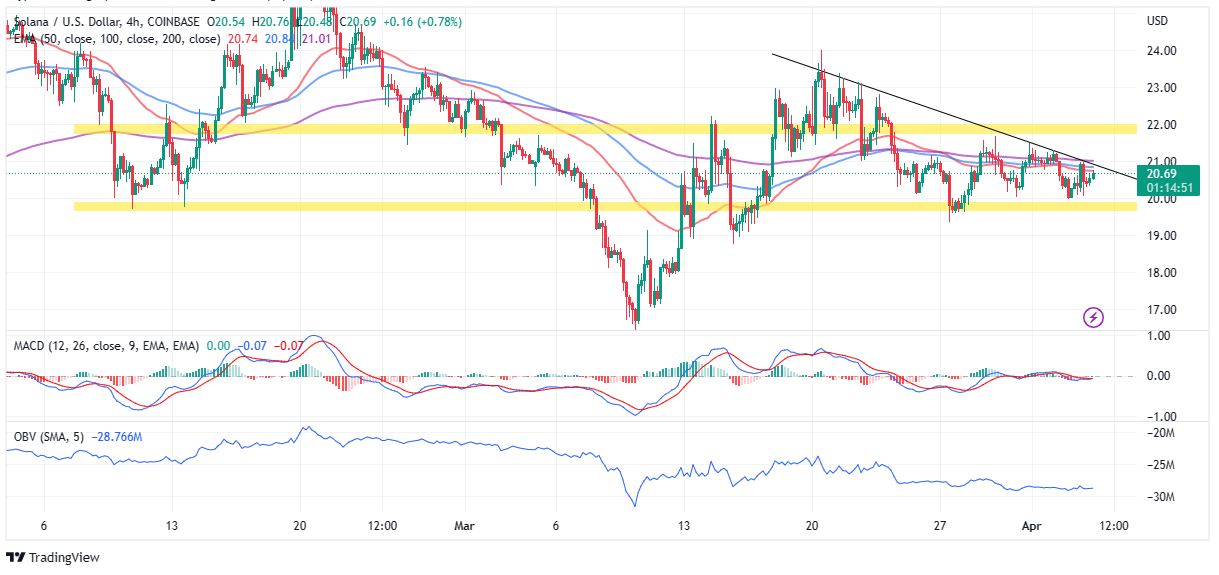
Although a break above the 50-day EMA is necessary, the bulls need to prepare for a strong challenge at $21.00. This is a confluence resistance zone brought about by the 200-day EMA (line in purple) and the descending trend line, as highlighted on the chart.
A bullish outcome is highly likely considering the buy signal from the Moving Average Convergence Divergence (MACD) indicator. Investors and traders are likely to consider increasing their positions in SOL as long as the MACD line in blue color stays above the signal line in red color.
However, to do this, Solana needs to see an increase in the amount of inflow to exceed the amount of outflow. For now, consolidation may take precedence, as seen with the On-Balance-Volume (OBV) indicator currently indicating negative volume inflow of -28.73M.
Failure to break and hold the immediate resistance of SOL at the 50-day EMA and the confluence seller congestion at $21.00 could delay the breakout with an eye on $24.00 in the near term.
Support at $20.00 will be expected to come in handy, but if push comes to shove and overhead pressure prevails for the bulls, Solana price may resolve to seek support at $16.00.
Evaluating Solana Price Short-Term Profitability
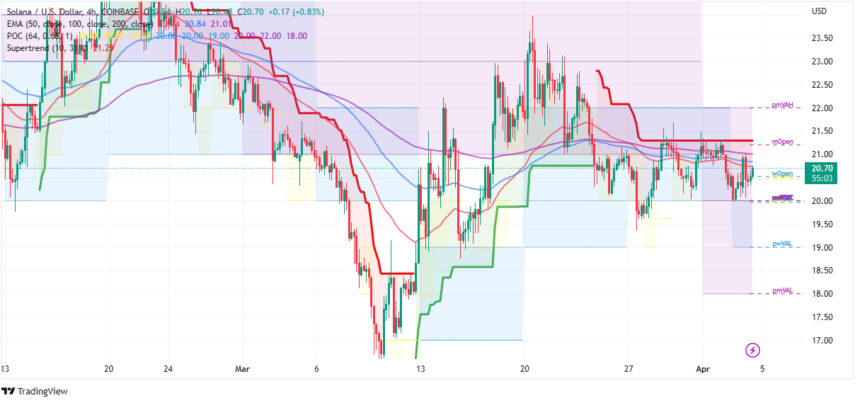
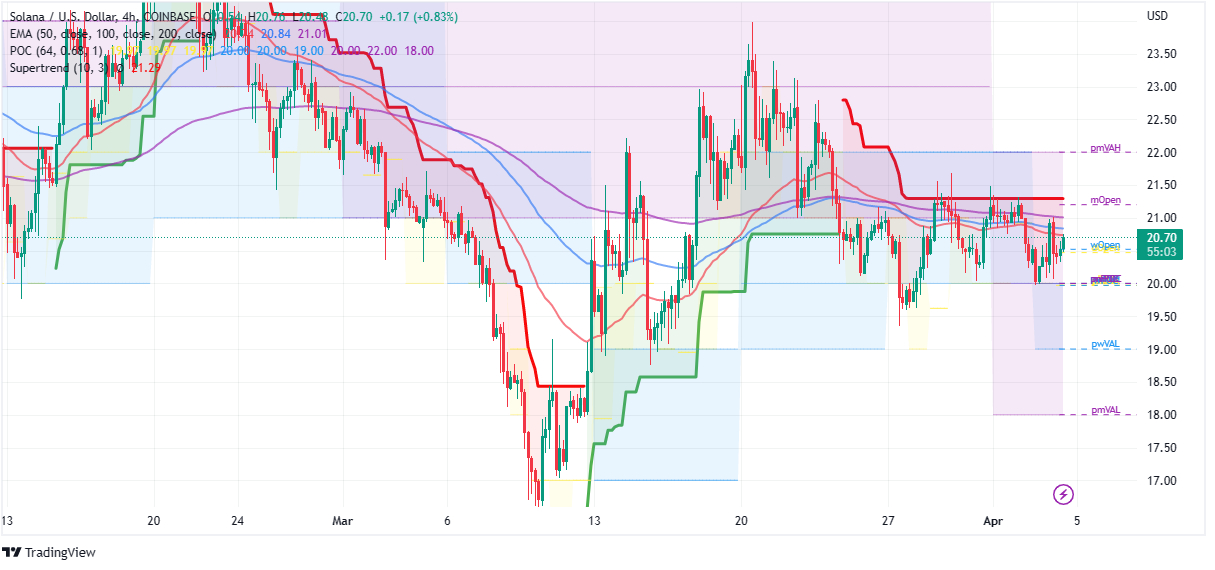
traders who want to find or increased exposure to Solanas The price on Tuesday should take into account these few parameters. For example, SOL is currently trading above its weekly open at $20.54, while the previous day’s open at $20.02 acts as a solid support area.

Solana price could become a contender for a monthly open at $21.21 if liquidity from the support at $20.00 is strong enough to break through the resistance brought by the 50-day EMA, 100-day EMA and 200-day EMA.
As previously established, a sustained break below the previous day’s open at $20.02 could see Solana price decline to reclaim the primary support at $16.00. However, investors should not ignore the short-term support areas at $19.00 and $18.00 respectively.
For investors looking for medium to long term exposure to SOL, the Supertrend indicator (thick line overlaying the chart) will flip below the price with its color changing from red to green before activating the position. It would be wise to wait till then.
Related Articles:


