
By bulls and bears meetings, crypto analysts have always given their prediction for where the price of a crypto-like bitcoin could end up. Usually this is the norm, but one analyst has delved deeper into the coin to provide an in-depth analysis of Bitcoin’s upward rally. The analysis covers several indicators, as well as their widespread acceptance BTC has been making gains lately.
Bitcoin price up to $70,000
The analysis shared on TradingView shows another side of the market that was previously untapped. The analyst using ArShevelev identifies the period between March and August as the ‘Stealth phase’, when most of the accumulation likely took place.
Next one, the cryptocurrency entered the ‘EW Channel’, which looks like it served as a springboard for the rally. From here it’s been an easy climb to get above $34,000. But this is where things start to get interesting.
At this level, the analyst predicts a decline in price. This pullback from $34,000 causes the price to fall back to $31,000 before the rally starts again. The end of this retest leads to the top of the third wave, where the price can reach $50,000 before another drop.
This sent the price to the $35,000 mark again to mark the fourth wave before bouncing back up to the fifth wave. Now, at this point, the analyst sees “media attention” coming into play (presumably mainstream and traditional financial media), and the launch from this level reaches the $70,000 mark.
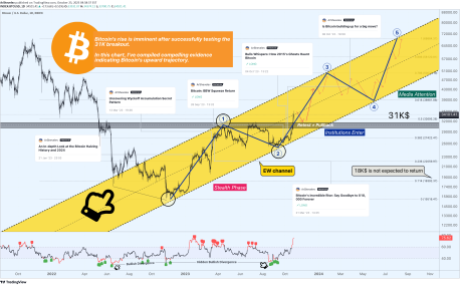
Roadmap to BTC at $70,000 | Source: Tradingview.com
Factors driving momentum
The crypto analyst presents seven major factors behind the predicted Bitcoin momentum leading to a bull market. To begin with, the first is the same as everyone expects: the almighty Bitcoin halving. This event is undoubtedly the most bullish in Bitcoin history and a repeat of it is expected to boost the bull market.
Next on the list is the Impulse Structure and Rising Channel, which the analyst believes is the BTC price is ‘to paint a convincing picture of the daily time frame’. This leads to the Third Wave speculation, as explained above. The analyst believes the market is in the third wave, with the fourth being a pullback and the fifth breaking above $70,000.
Fourth on the list is the Wyckoff Accumulation Pattern, where Bitcoin is already showing strength. Then there is the Bollinger Bands Wide Squeeze, which has fallen to 2014 levels. “This rarity accentuates Bitcoin’s growth potential and serves as a strong indicator for investors,” says ArShevelev.
The sixth factor is the historical comparisons comparing current price action to previous market trends. The 2023 bear market looks more like the 2015 bear market, as the analyst notes, and this could see a price increase of almost 100%, just like in 2015. This would push the Bitcoin price above $50,000.
Last but not least, there is institutional interest, which has been on the rise lately. This is mainly due to the enthusiasm that prevails Black rockthe world’s largest asset manager, filing a Spot Bitcoin ETF and potentially bringing Bitcoin to its $8 trillion-plus portfolio.
ArShevelev explains that a Discover Bitcoin ETF “promises to be a game-changer” due to its ability to connect TradFi with crypto and flow more money into Bitcoin. “The arrival of the ETF not only means regulatory recognition, but also invites a wave of private participation,” the crypto analyst said. “Institutional investors are expected to further consolidate this upward trajectory as the holiday season approaches.”
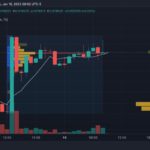
BTC falls to $34,398 | Source: BTCUSD on Tradingview.com
Featured image of The Crypto Basic, chart from Tradingview.com


