
Bitcoin price continues to smash resistance levels while regaining previously lost ground. Unlike other rallies in the current area, this price action could signal a continued trend and a new dawn for the industry after months of corporate collapses and bankruptcies.
At the time of writing, Bitcoin (BTC) is trading at USD 22,800 with sideways movement in the last 24 hours. In the previous week, the cryptocurrency posted a 10% gain. Other cryptocurrencies in the top 10 by market capitalization are experiencing similar price action during this period with significant gains.

Is Bitcoin finally at its lowest level?
According to a analyst at Jarvis Labs, the current Bitcoin rally is the result of a long period of consolidation below the 200-day moving average (MA). This moving average is one of BTC’s most important levels and acts as critical support during bearish cycles.
As Bitcoin reclaims the 200-day MA at around $19,520, the analyst wants to see a consolidation above this level. The rally could extend if the cryptocurrency can stay above it, pushing BTC to further highs, solidifying “a reversal of the 200-day MA from resistance to support.”
As can be seen in the chart below, during the 2019 bear market, BTC saw a long consolidation below its 200-day MA before regaining these levels later in the year. According to the analyst, the longer the consolidation, the better the improvement for BTC’s overall market structure as other moving averages rise.

The above does not imply that Bitcoin will continue to climb upwards, back to its all-time high of $69,000. Instead, it suggests that BTC’s market health is improving, increasing the basis for further gains.
This new status quo turns any potential downturn into an opportunity for optimistic investors. The Jarvis Labs analyst wrote:
(…) And while there is still a fairly good chance that price levels will be reviewed in early January sometime in 2023, there is also strong data suggesting that such a retest would present an excellent buying opportunity.
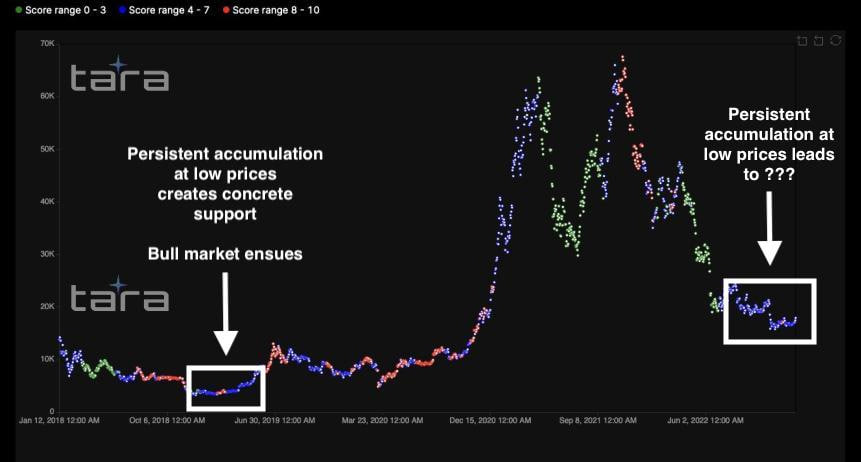
Accumulation levels point to 2019 like BTC Bottom
In addition to this period of consolidation below the 200-day MA, which indicates a 2019-like bottom, BTC has seen “continued accumulation.” The image below shows that Bitcoin investors have “moderately” (blue dots in the chart below) accumulated more of the cryptocurrency.
Similar to the 2018-2019 bear market, this accumulation period preceded market rallies. In the coming months, Bitcoin should see more aggressive accumulation (red dots in the chart below) to support another bullish season.
The US Federal Reserve (Fed) remains the biggest obstacle to a Bitcoin rally. The financial institution raises interest rates to reduce inflation while harming the financial markets.
Market participants expect the Fed to adjust monetary policy, but gains in stocks and crypto, combined with continued inflation, could cause the opposite. If this happens, optimistic investors may see the buying opportunity presented by the Jarvis Labs analyst.


