
Glassnode has pointed out some bizarre consistency between current and previous Bitcoin cycles in terms of a statistic, here’s what.
Bitcoin breaks above 200-day simple moving average line
A “simple moving average” (SMA) is an analytical tool that produces an average of a certain quantity over a certain period of time. As the name implies, it moves with the amount and the value changes accordingly.
SMAs can be very useful for studying long-term trends because they smooth out the curve and filter out any short-term fluctuations in the relevant amount that would not affect the longer trends anyway. As is usually the case with these types of tools, an SMA can be used for a certain amount of time, but a few periods such as 7 days and 30 days generally find the most use.
This is evident from data from the on-chain analytics company Glasnode, BTC has spent 381 days below its 200-day SMA curve in this cycle. The 200-day SMA is an important line for BTC, as both bear-to-bull and vice versa transitions have historically occurred with breaks above or below this level.
Here is a chart showing the trend in the 200-day SMA for Bitcoin over the past few years:
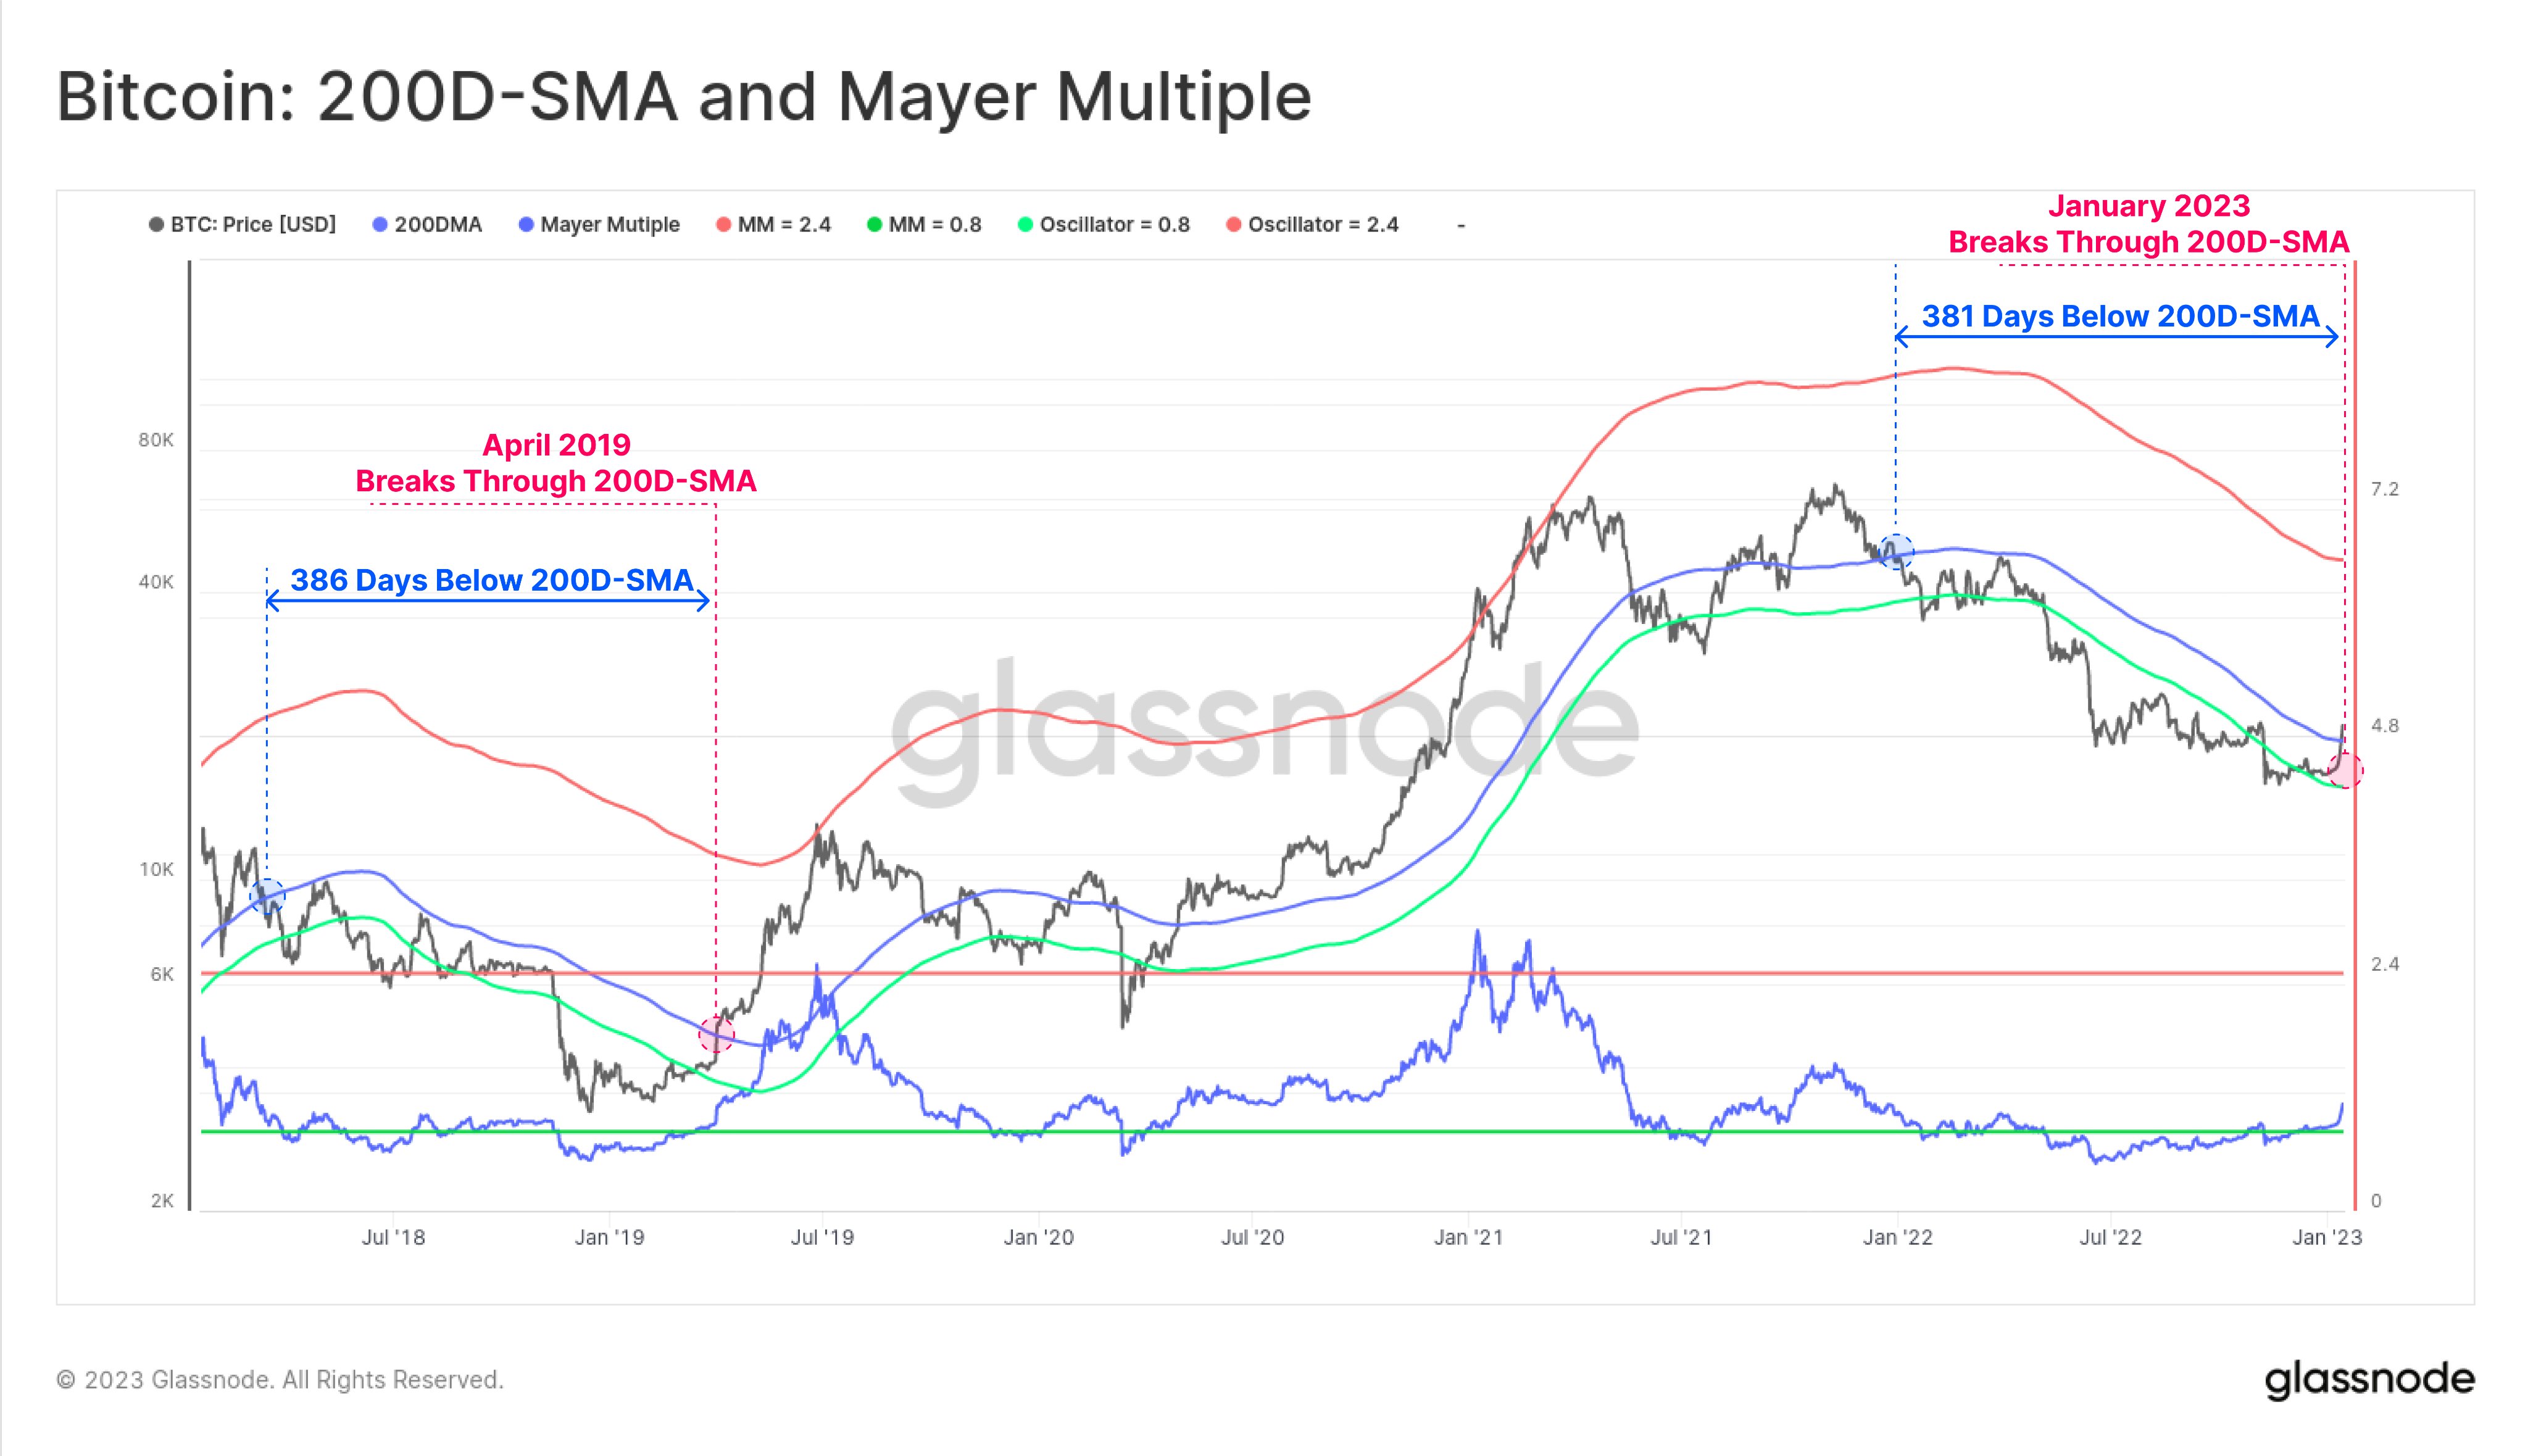
The value of the crypto seems to have broken above the 200-day SMA in recent days | Source: Glassnode on Twitter
As shown in the chart above, Bitcoin price had fallen below the 200-day SMA around the start of the bear market and had remained there until recently. In total, the crypto had spent 381 days below this level before the final rally arrived and finally helped the coin escape above this line.
In the chart, Glassnode has also marked the trend for the metric during the previous bear market. It appears that in that cycle too, the price of the cryptocurrency had fallen below the 200-day SMA as the bear began to hold. Also, the eventual break above the level leads to the end of what was then a bear market for the currency.
Most interesting of all, however, is the length of time Bitcoin remained below this level in that cycle: 386 days. Amazingly, this is almost the same number of days (381) it took for BTC to top the mark in the current cycle.
If this bizarre consistency is anything to go by, then the latest push above the 200-day SMA could mean the current bear market could also be done.
The chart also shows data for an indicator called the “Mayer Multiple(MM) measuring the current distance between Bitcoin’s price and the 200-day SMA. The value is simply calculated by dividing the value of the cryptocurrency by the 200-day SMA. Bottoms in crypto have mostly occurred below the 0.8MM level, which BTC is now firmly above.
BTC price
At the time of writing, Bitcoin is trading around $20,800, up 21% over the past week.

BTC consolidates just below $21,000 | Source: BTCUSD On TradingView
Featured image by André François McKenzie on Unsplash.com, charts from TradingView.com, Glassnode.com


